England's gem at No. 3
Jonathan Trott struggled in his last couple of series', but through large parts of his career he was superb for England at one-down
S Rajesh
08-May-2015
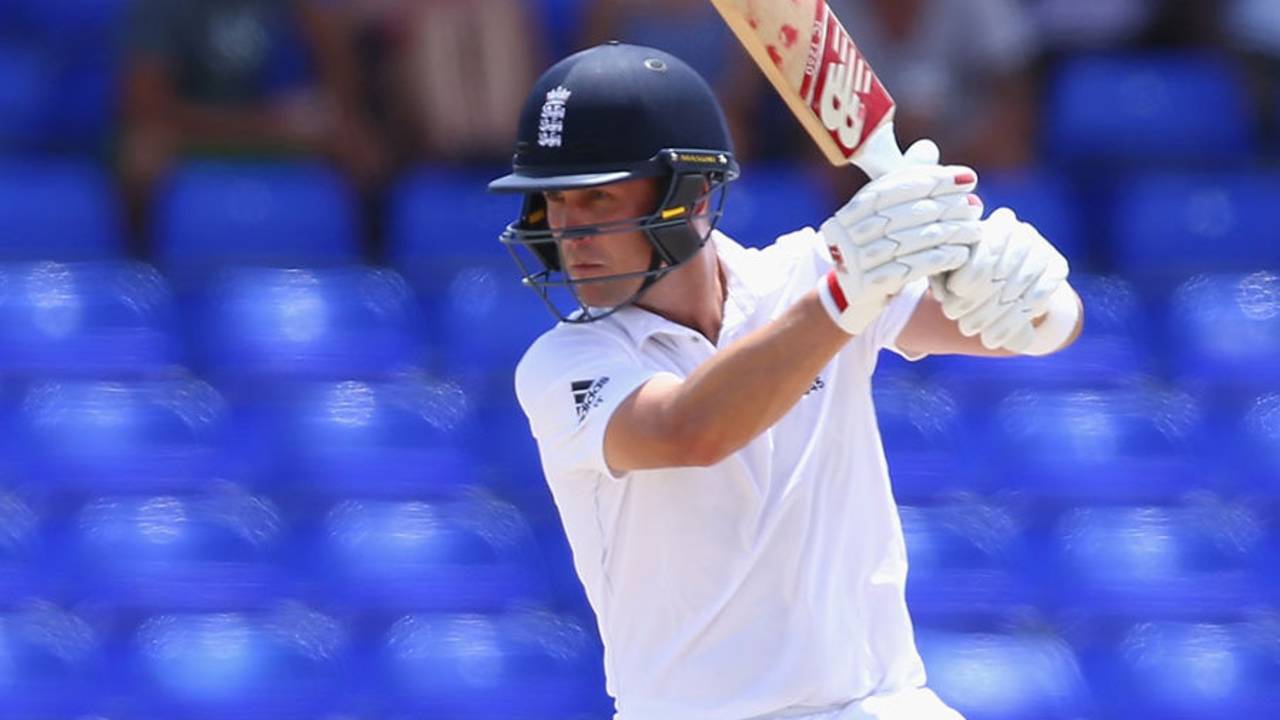
Only Wally Hammond scored more Test runs at No. 3 for England than Jonathan Trott • Getty Images
The last couple of series didn't pan out the way Jonathan Trott would have wanted them to, but despite that, his international career was one with far more hits than misses. The Test average dipped a few points but still finished on an impressive 44.08, while he is one of only six batsmen to score 2500-plus ODI runs at an average of more than 50. Those are stats that he can justifiably be proud of.
Though he averaged more in ODIs, Trott clearly made a greater impact in Tests. After his first 21 matches he averaged 62.23, with six centuries and as many fifties from 34 innings. In the second innings of his first Test, against Australia at The Oval in 2009, he scored 119, making him the 18th England batsman to make a century on Test debut, and only the second to do so against Australia since 1940. (The other England batsman to achieve it during this period was Graham Thorpe, who also finished with a career average between 44 and 45.) When England toured Australia in 2010-11, Trott was again among the runs with 445 in seven innings, including an unbeaten 168 in the Boxing Day Test, which won him his maiden Man-of-the-Match award. When he scored 203 in the first Test of the home season against Sri Lanka in 2011, Trott's Test average had zoomed to a dizzying 66.77, the highest it would ever get (apart from his first Test).
Over the next couple of seasons, Trott's average dipped by about a third, but it was still pretty good at 40.61. In the two series preceding the 2013 home Ashes, Trott averaged 56.40 in New Zealand, and 49.75 against them in England, with four 50-plus scores in nine innings. Going into the 2013 Ashes series, Trott had a career average of 50.01 from 43 Tests. Nine horrible Tests later, it had slipped by nearly six points. Of the eight times he was dismissed without scoring in his Test career, five came during this period, in his last 18 innings.
| Period | Innings | Runs | Average | 100s/ 50s |
| First 21 Tests | 34 | 1867 | 62.23 | 6/ 6 |
| Next 22 Tests | 41 | 1584 | 40.61 | 3/ 10 |
| Last | 18 | 384 | 21.33 | 0/ 3 |
| Career (52 Tests) | 93 | 3835 | 44.08 | 9/ 19 |
The rock at No. 3
Of the 93 innings Trott played in Tests, 73 came at the No. 3 slot, a position that's traditionally been a weak spot for England: in all Tests from 1990 till Trott's Test debut in August 2009, England's No. 3 batsmen collectively averaged 36.63, which was poorer than all teams except Pakistan, Bangladesh and Zimbabwe. In the same period, the No. 3s for India and Australia averaged around 49, while three other teams also had 40-plus averages at that slot.
Of the 93 innings Trott played in Tests, 73 came at the No. 3 slot, a position that's traditionally been a weak spot for England: in all Tests from 1990 till Trott's Test debut in August 2009, England's No. 3 batsmen collectively averaged 36.63, which was poorer than all teams except Pakistan, Bangladesh and Zimbabwe. In the same period, the No. 3s for India and Australia averaged around 49, while three other teams also had 40-plus averages at that slot.
In the four-and-a-half years when Trott was batting at that slot, though, England's average at No. 3 jumped up to 44.05, which was fourth among all teams, after Sri Lanka, South Africa, and India. During this period, while eight other England batsmen also batted at three, they collectively played 24 innings, compared to 73 by Trott. Clearly, Trott's presence significantly lifted England's stock at the one-drop position.
| Team | Inns (1990-Jul 2009) | Average | 100s | Inngs (Aug '09-2013) | Average | 100s |
| India | 287 | 49.13 | 32 | 79 | 51.73 | 14 |
| Australia | 377 | 48.68 | 54 | 96 | 32.82 | 4 |
| Sri Lanka | 268 | 44.72 | 28 | 66 | 60.41 | 14 |
| South Africa | 297 | 42.04 | 27 | 63 | 60.15 | 13 |
| West Indies | 327 | 40.28 | 32 | 66 | 34.86 | 4 |
| New Zealand | 283 | 36.76 | 18 | 71 | 29.79 | 2 |
| England | 422 | 36.63 | 33 | 97 | 44.05 | 9 |
| Pakistan | 270 | 36.12 | 25 | 73 | 37.75 | 4 |
| Zimbabwe | 156 | 28.75 | 5 | 20 | 27.42 | 2 |
| Bangladesh | 120 | 27.94 | 3 | 40 | 32.23 | 2 |
Among all No. 3 batsmen for England, only Wally Hammond has scored more runs. In 52 innings, Hammond made 3440 runs at an average of 74.78, with an incredible conversion rate of 14 centuries and four fifties. Those are much better numbers than Trott's 3109 runs in 73 innings at 45.72, but Hammond played his last Test match more than 65 years ago. Among those who came after him, only two - Ted Dexter and David Gower - batted at least 50 innings at No. 3 and finished with a better average.
| Batsman | Inns | Runs | HS | Average | 100s/ 50s |
| Wally Hammond | 52 | 3440 | 336* | 74.78 | 14/ 4 |
| Ted Dexter | 57 | 2798 | 205 | 51.81 | 6/ 16 |
| David Gower | 56 | 2619 | 215 | 49.41 | 8/ 10 |
| Jonathan Trott | 73 | 3109 | 226 | 45.72 | 7/ 15 |
| Nasser Hussain | 65 | 2352 | 155 | 40.55 | 6/ 13 |
| Mark Butcher | 78 | 2796 | 173* | 38.3 | 6/ 17 |
Trott the ODI player
Trott got plenty of flak for his scoring rate in ODIs, and some of that was probably justified: among the 43 batsmen who scored at least 1800 ODI runs between 2009 and 2013, only four batsmen had a lower strike rate than Trott's 77.06. Misbah-ul-Haq (strike rate 70.04) often had to resurrect Pakistan's batting after early collapses, while Darren Bravo and Mushfiqur Rahim are members of relatively weak teams. Upul Tharanga (76.23) had a marginally lower strike rate than Trott, but he had other strokeplayers in the team to compensate. With Trott, the criticism also built up because of the others in the England line-up who batted similarly: Ian Bell had a strike rate of 78.33 during this period, while Alastair Cook was slightly better at 82.80. However, Trott had a better ODI average than Bell (38.90) or Cook (43.02) during that period, which means he also consumed more balls per dismissal; it was often felt that another, more aggressive batsman might have helped England's cause more than Trott did.
Trott got plenty of flak for his scoring rate in ODIs, and some of that was probably justified: among the 43 batsmen who scored at least 1800 ODI runs between 2009 and 2013, only four batsmen had a lower strike rate than Trott's 77.06. Misbah-ul-Haq (strike rate 70.04) often had to resurrect Pakistan's batting after early collapses, while Darren Bravo and Mushfiqur Rahim are members of relatively weak teams. Upul Tharanga (76.23) had a marginally lower strike rate than Trott, but he had other strokeplayers in the team to compensate. With Trott, the criticism also built up because of the others in the England line-up who batted similarly: Ian Bell had a strike rate of 78.33 during this period, while Alastair Cook was slightly better at 82.80. However, Trott had a better ODI average than Bell (38.90) or Cook (43.02) during that period, which means he also consumed more balls per dismissal; it was often felt that another, more aggressive batsman might have helped England's cause more than Trott did.
That might have been a valid criticism of Trott, but none can deny the solidity he brought to England's top order in ODIs too. Among the 22 England batsmen who've scored at least 2000 runs in this format, none have an average anywhere near Trott's 51.25; the next-best is Kevin Pietersen's 41.32.
Moreover, one look at England's stats at No. 3 since Trott last played an ODI illustrates just how valuable he was at that position: in 37 matches, England's No. 3 batsmen have averaged 22.79 at a strike rate of 69.81; in 61 matches at No. 3, Trott had an average of 49.71 and a strike rate of 77.97.
| Player | Innings | Runs | Average | SR | 100 | 50 |
| Jonathan Trott | 61 | 2585 | 49.71 | 77.97 | 4 | 19 |
| Since Trott | 36 | 775 | 22.79 | 69.81 | 0 | 6 |
| Player | Mat | Runs | Average | SR | 100 | 50 |
| Jonathan Trott | 68 | 2819 | 51.25 | 77.06 | 4 | 22 |
| Kevin Pietersen | 134 | 4422 | 41.32 | 86.7 | 9 | 25 |
| Nick Knight | 100 | 3637 | 40.41 | 71.52 | 5 | 25 |
| Neil Fairbrother | 75 | 2092 | 39.47 | 72.06 | 1 | 16 |
| Allan Lamb | 122 | 4010 | 39.31 | 75.54 | 4 | 26 |
| Robin Smith | 71 | 2419 | 39.01 | 69.65 | 4 | 15 |
| Ian Bell | 161 | 5416 | 37.87 | 77.16 | 4 | 35 |
| Marcus Trescothick | 123 | 4335 | 37.37 | 85.21 | 12 | 21 |
| Graeme Hick | 120 | 3846 | 37.33 | 74.08 | 5 | 27 |
| Graham Thorpe | 82 | 2380 | 37.18 | 71.17 | 0 | 21 |
As mentioned earlier, Trott is one of only six batsmen to score at least 2500 ODI runs at a 50-plus average. Four of the other five are still active ODI players, which means their average may or may not stay above 50 by the time they retire. Michael Bevan is the only other retired batsman in this list - his strike rate is similar to Trott's though he played in an earlier era.
Scoring quickly was never Trott's forte, but his solidity and his ability to bat long periods was an asset that England have missed since, especially during the 2015 World Cup. The West Indies tour showed his level had dropped from his best days, but at his peak, Trott was a gem for England at No. 3.
| Player | Mat | Runs | Average | SR | 100 | 50 |
| Hashim Amla | 115 | 5692 | 55.26 | 89.92 | 20 | 28 |
| AB de Villiers | 187 | 7941 | 53.65 | 99.12 | 20 | 46 |
| Michael Bevan | 232 | 6912 | 53.58 | 74.16 | 6 | 46 |
| MS Dhoni | 262 | 8499 | 52.46 | 89.17 | 9 | 58 |
| Virat Kohli | 158 | 6537 | 51.47 | 89.73 | 22 | 33 |
| Jonathan Trott | 68 | 2819 | 51.25 | 77.06 | 4 | 22 |
| Michael Hussey | 185 | 5442 | 48.15 | 87.16 | 3 | 39 |
| Zaheer Abbas | 62 | 2572 | 47.62 | 84.8 | 7 | 13 |
S Rajesh is stats editor of ESPNcricinfo. Follow him on Twitter