Nepse technical analysis january 1 january 5, 2017
•
0 likes•421 views

NEPSE Technical Analysis January 1 - January 5, 2017.

Recommended
Recommended
More Related Content
What's hot
What's hot (20)
Viewers also liked
Viewers also liked (7)
Similar to Nepse technical analysis january 1 january 5, 2017
Similar to Nepse technical analysis january 1 january 5, 2017 (19)
More from Kriti Capital & Investments Ltd.
More from Kriti Capital & Investments Ltd. (8)
Recently uploaded
Recently uploaded (20)
Nepse technical analysis january 1 january 5, 2017
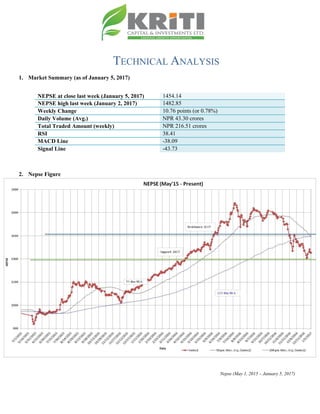
- 1. TECHNICAL ANALYSIS 1. Market Summary (as of January 5, 2017) NEPSE at close last week (January 5, 2017) 1454.14 NEPSE high last week (January 2, 2017) 1482.85 Weekly Change 10.76 points (or 0.78%) Daily Volume (Avg.) NPR 43.30 crores Total Traded Amount (weekly) NPR 216.51 crores RSI 38.41 MACD Line -38.09 Signal Line -43.73 2. Nepse Figure Nepse (May 1, 2015 – January 5, 2017)
- 2. 3. Trend Analysis The Nepse index gained 10.76 points (or up 0.78%) to close at 1454.14. Nepse gained 39.47 points on the first two trading days of last week. However, it lost 26.03 points towards the middle of the week. The 200 day moving average has crossed above the 50 day moving average, signaling bearish sentiment in the market. The average volume turnover decreased to NPR 43.30 crores from NPR 52.61 crores the week prior. 4. Resistance and Support Immediate Support 1407 Support 2 1350 Immediate Resistance 1605 Resistance 2 1671 The Nepse index hovered between the current immediate support and resistance level of 1407 and 1605 respectively. As uncertainty looms over the market, the index will likely hover between the support and resistance level in days to come. 5. Trend Indicator a.) MACD The MACD is a momentum oscillator formed by using two different types of moving averages, which provides specific buying or selling signals. When a MACD line crosses above the signal line, it is considered to be a positive sign and indicates a time to buy, and vice-versa. The Macd and the signal line, at the beginning of last week, stood at -48.68 and -48.39 respectively. In the course of the week, the macd and signal line climbed up by 10.59 and 4.67, to close at -38.09 and -43.73 respectively. The macd line crossing above the signal line indicates a bullish trigger.
- 3. b.) RSI RSI is a form of leading indicator that is believed to be most effective during periods of sideways movement. Such indicators may create numerous buy and sell signals that are useful when the market is not clearly trending upwards or downwards. The RSI, at the beginning of last week, stood at 38.91 level. In the course of the week, it lost a miniscule 0.49 points to close at 38.41 level. The RSI indicator shows that the market could move sideways in the coming weeks. c.) Bollinger Bands The Bollinger Band is a technical indicator that consists of a moving average (21-day) along with two trading bands above (upper band) and below it (lower band). The bands are an indication of volatility, which are represented by calculating standard deviation. The benchmark index is hovering between the lower and middle bollinger bands, indicating a decrease in selling pressure in the market. The distance between the upper and lower bands remain wide, signifying moderate market volatility.
- 4. 6. Overview The Nepse index increased by 10.76 points (or up 0.78%) to close at 1454.14 last week. The index continues to show bearish presence as Nepse is below the 200-day moving average. Furthermore, the 50 day moving average has crossed below the 200 day MA as well. The RSI is currently moving sideways, hovering at 38.41 level. The macd line shows a bullish trigger as it has moved above the signal line. However, both the lines are at negative territory. The bollinger bands show moderate market volatility. The new support and resistance level stands the same at 1407 and 1605 respectively.
- 5. k|fljlwsljZn]if0f !_ahf/ ;f/f+z -kf}if@!, @)&#;Ddsf]_ aGb cªs -kf}if@!, @)&#_ !$%$=!$ pRr cªs -uPsf] ;ftf_ !$*@=*% ;fKtflxs kl/jt{g !)=&^ -)=&*k|ltzt_ b}lgscf};t Jofkf/ ¿=$#=#)s/f]8 s'n ;fKtflxsJofkf/ ¿ @!^=%! s/f]8 cf/P;cfO{ #*=$! PdP;L8L –#*=)( l;UgnnfO{g –$#=&# @_ ahf/ k|j[lt Nepse (May 1, 2015 – January 5, 2017)
- 6. #_ 6]«G8 ljZn]if0f uPsf] ;ftfg]K;] kl/;"rsdf!)=&^cªssf] a[l4 b]lvof]h;sf] kmn:j?kahf/ !$%$=!$cªsdfaGbeof] .g]K;] kl/;"rsclxn] klg@))lbg] d'leËPe/]heGbftn /x]sf] cj:yf 5 h;n] ahf/dflaol/; 6]«G8df /x]sf] l:ylt b]vfpF5 . ;fy} %) lbg] d'leËPe/]h @)) lbg] d'leËPe/]h eGbftncfPsf] cj:yfn]ahf/ cem} laol/; l:yltdf /x]sf] b]lvG5 . cf};tsf/f]af/ /sddfklglu/fj6 b]lvof] hf]$#=#) s/f]8df cfPsf] 5 . $_ 6]jftyfk|lt/f]w cªs glhssf] 6]jfcªs !$)& 6]jfcªs @ !#%) glhssf] k|lt/f]w cªs !^)% xfnsf] nflu !$)&cªs 6]jfcªstyf !^)% cªsgofFk|lt/f]w cªssf] ?kdf /x]sf] 5 . xfnsf] nflu kl/;"rs !$)) cªsdf /xg] ;Defjgf b]lvPsf] 5 . %_ g]K;] 6]«G8 ;"rs s_ d'leª Pe/]hsGeh]{G; 8fOeh]{G; -PdP;L8L_ PdP;L8Ldf b'O{ cf]6f /]vf x'G5g, h;df Pp6fn] ahf/sf] lbzf kl/jt{gsf] ;+s]t u5{ eg] csf]{n] ahf/sf] k|j[lQ -6«]08_ b]vfpg] u5{ . olb PdP;L8L /]vfn] l;Ung /]vfnfO{ tnaf6 dfly sf6]dfo;nfO{ ;sf/fTds ;+s]tsf ?kdflnO{G5 / o;n] z]o/x? lsGg] ;+s]t ub{5 . ;ftfsf] z'?df PdP;L8L nfO{g tyfl;UgnnfO{g s|dzM–$*=^*tyf–$*=#(sf] l:yltdf /x]sf] lyof]tyf;ftfsf] cGTodfPdP;L8LnfO{g tyfl;UgnnfO{g s|dz M !)=%(tyf$=^&cªsn] a9]sf] 5 .PdP;L8L nfO{gn]l;UgnnfO{gnfO{g nfO{g nfO{ sf6L dflycfPsf] cj:yf 5 h;n] ahf/ a'lnz 6]«G8df b]vfpF5 .
- 7. v_ l/n]l6j :6«]Gy OG8]S; -cf/P;cfO{_ cf/P;cfO{ k|fljlwsljZn]if0fsf] o:tf] cf}hf/ xf], h;nfO{ Pstlkm{ ?kdfrln/x]sf] ahf/dfJofkf/ /0fgLlt agfpg a9L pkof]uL dflgG5 . To;}u/L, o;n] ahf/dfvl/b / ljlqmsf] :ki6 ;+s]t b]vfpg] u5{ . cf/P;cfO{uPsf] ;ftfsf] z'?df#*=(!cªsdf/x]sf] lyof]tyf ;ftfsf] cGTolt/ cf/P;cfO{ #*=$!cªsdf /xof].#) cªssf] xf/fxf/LdfcfPsf] cf/P;cfO{n] ahf/dfs]xLlbg ;fO{8j]h d'ed]G6 b]lvg ;Sg] ;+Defjgf b]vfpF5 .
- 8. u_ af]lnªu/ Aof08 af]lnªu/ Aof08 Ps k|fljlwsljZn]if0f ;"rsxf] h;df @!–lbg] d'leËPe/]hsf ;fyb'O{ Aof08 -Pp6f dfly_ / Pp6f tn_ x'G5g . lo Aof08x?n] cl:y/tfsf] ;+s]t ub{5g, h'g :6fG88{ 8]leP;g u0fgf u/]/ kQfnufO{G5 . g]K;] kl/;"rsclxn]sf] cj:yfdfdWotyftNnf] Aof08 aLrrln/x]sf] cj:yf /x]sf] 5 h;n] ahf/df a]Rg] xf]8afhLdf s]xLsdLcfPsf] ;+s]t ub{5 . pkNnf] tyftNnf] Jof08 aLrdfa9]sf]b'/Ln] ahf/sf] cl:yt/tfeg] cem} sfod /x]sf] b]vfFp5 . ;du{dfM uPsf] ;ftf g]K;] kl/;"rsdf!)=&^cªssf] a[l4 g} b]lvof]h;sf] kmn:j?kahf/ !$%$=!$cªsdfaGbeof] . g]K;] kl/;"rs @)) lbg] d'leËPe/]h eGbftncfPsf] cj:yfn] ahf/ clxn] klglaol/ l:yltdf /x]sf] b]vfFp5 #)cªssf] xf/fxf/LdfcfPsf] cf/P;cfO{n] ahf/ cf]e/–;f]N8 l:yltdf cfPsf] blvG5 / la:tf/] cf]e/ ;f]N8 l:yltnfO{ 5f]l8 dflycfpg ;sg] ;Defjgf /x]sf] 5 . pkNnf] tyftNnf] Jof08 aLrdfcem} klg s]xL b'/L /x]sf] n]cl:yt/tfsfod /x]sf] b]lvG5 .xfnsf] cj:yfdfgofF 6]jfcªstyfk|lt/f]w cªs s||dzM !$)&tyf !^)%sfod /x]sf] 5 .