


A primary mode-of-action of all pyrethroid insecticides (PYRs) is the disruption of the voltage-gated sodium channel electrophysiology in neurons of target pests and nontarget species. The neurological actions of PYRs on non-neuronal cells of the nervous system remain poorly investigated. In the present work, we used C6 astrocytoma cells to study PYR actions (0.1–50 μM) under the hypothesis that glial cells may be targeted by and vulnerable to PYRs. To this end, we characterized the effects of bifenthrin (BF), tefluthrin (TF), α-cypermethrin (α-CYP), and deltamethrin (DM) on the integrity of nuclear, mitochondrial, and lysosomal compartments. In general, 24- to 48-h exposures produced concentration-related impairment of cell viability. In single-compound, 24-h exposure experiments, effective concentration (EC)15s 3-(4,5-dimethyl-thiazol-2-yl)-2,5-diphenyl-tetrazolium bromide (MTT assay) were computed as follows (in μM): BF, 16.1; TF, 37.3; α-CYP, 7.8; DM, 5.0. We found concentration-related damage in several C6-cell subcellular compartments (mitochondria, nuclei, and lysosomes) at ≥ 10−1 μM levels. Last, we examined a mixture of all PYRs (ie, Σ individual EC15) using MTT assays and subcellular analyses. Our findings indicate that C6 cells are responsive to nM levels of PYRs, suggesting that astroglial susceptibility may contribute to the low-dose neurological effects caused by these insecticides. This research further suggests that C6 cells may provide relevant information as a screening platform for pesticide mixtures targeting nervous system cells by expected and unexpected toxicogenic pathways potentially contributing to clinical neurotoxicity.
Whether simultaneous low-level exposure to multiple pesticides may be a potential etiological factor of nervous system disorders is still under debate (Carpy et al., 2000; Hernández et al., 2013; McManus et al., 2013). In general, toxicological studies considered to establish safe pesticide exposure levels often use testing conditions based on the available evidence of the mode-of-action (MOA) and dose-response assays in laboratory animals administered a few doses of a single compound to estimate reference doses, ie, threshold dose levels above which toxicity may be expected in susceptible individuals (Izadi et al., 2012; USEPA, 2002). Regulatory study designs “blind” to “secondary” target sites may be expected to contribute to the overall health risk uncertainty, especially when members of a pesticide class such as pyrethroids (PYRs) present toxicological divergence (Wolansky and Harrill, 2008).
PYRs are synthetic insecticides increasingly used in home and agricultural pest control (Krieger, 2010). Low levels of PYR residues are present in water streams, soil, air, food, homes, human urine, and breast milk (CDC, 2015; Corcellas et al., 2012; FDA, 2015; Morgan, 2012; Tulve et al., 2006; Wielgomas et al., 2013). PYRs have been historically classified into subclasses as follows: type I compounds, which do not contain an α-cyano group, and type II compounds, which do contain this group. In general, type-I PYRs induce T-syndromes in small rodents, characterized mainly for the presence of tremors, whereas type-II PYRs induce CS-syndromes, causing choreoathetosis and salivation. There are also a few PYRs classified as mixed-type I/II, which produce a TS-syndrome, causing tremors and salivation (Wolansky and Harrill, 2008).
PYRs may produce intense electrophysiological alterations in targeted neurons in the nervous system, supporting the general classification of these insecticides as neurotoxicants (Soderlund et al., 2002). Most of the research conducted during the last decades has explored the clinical manifestations resulting from the disruption of neuronal voltage-gated sodium channel (VGSC) conductance, proposed to be central to the mechanism of PYR toxicity in mammals (Narahashi et al., 2007; Soderlund et al., 2002). However, evidence for alternative target sites, including pharmacological actions of several cyano-PYRs in the GABAergic system, electrophysiological changes in other voltage-gated ion channels, and modulation of neurotransmitter release or uptake rates, has been generated (Crofton and Reiter, 1987; Krieger, 2010; Shafer and Meyer, 2004; Soderlund, 2012; Soderlund et al., 2002). Moreover, PYRs can cause endocrine disruption, reduction in beating frequency and amplitude in cultures of cardiac myocytes, inhibition of spontaneous glutamate network-dependent spikes and bursts in primary cultures of neurons, liver tumors, and teratogenic effects in the rat (Go et al., 1999; Koureas et al., 2012; Natarajan et al., 2006; Osimitz and Lake, 2009; Pine et al., 2008; Shafer et al., 2008; Tsuji et al., 2012).
Data on neurological effects in laboratory animals is not sufficient to ascertain the vulnerability of glia-related cells after low-dose exposure to PYRs. Astrocytes constitute approximately 50% of the brain tissue and actively participate in physiological mechanisms required to maintain normal conditions in neurons, including glutamate reuptake in the synaptic junction, glutamine release, and K+ and H+ buffering (Sofroniew and Vinters, 2010). Some in vivo studies in adult rats have shown that PYRs may damage brain astroglia in addition to targeting neurons. Malkiewicz et al. (2006) found a decrease in Glial fibrillary acidic protein (GFAP) immunoreactivity without any evident change in the number or morphology of astrocytes in several brain regions a few weeks after 6-day oral exposure to low-effective doses of cypermethrin (CYP), whereas Tayebati et al. (2009) reported increased number and size of GFAP-immunoreactive cells in cortical and hippocampal regions after a dermal exposure scheme simulating a maximal occupational exposure to the same PYR for 4 weeks. In addition, Abdel-Rahman et al. (2001) found that a low-dose dermal exposure to permethrin prolonged for 60 days caused multiple alterations in the central nervous system, including neuronal cell death and astrocyte hypertrophy in the hippocampus and cerebellum. Mense et al. (2006) observed that exposure to 100–102 µM concentrations of another PYR, Cyfluthrin, for 7–14 days caused alterations in cell culture growth and various functional markers of human fetal astrocytes. These authors found that while lactate dehydrogenase release and glutamate uptake assays showed astrocyte susceptibility starting at low µM levels, the cell number was reduced only at concentrations ≥ 25 µM and activation of apoptosis-related factors were observed at 50–100 µM. Furthermore, in the rat brain astroglia-derived C6 cell line, Culliford et al. (2004) reported that cyano- and noncyano-PYRs altered ion and organic osmolyte trafficking phenomena in the plasma membrane and cell volume-related signaling processes after exposure to 100 µM. Last, Maurya et al. (2012) assessed the developmental neurotoxicity of CYP after 2-week oral exposure (10–25 mg/kg as a daily dose) in infant rats and also examined primary cultures of rat brain astrocytes after exposure for 24–48 h to this compound (50–200 µM). These CYP studies showed increased rates of apoptosis in cerebral cortex astrocytes. In general, these previous studies did not test a representative selection of cyano- and noncyano-PYRs using a glia-derived cell culture under comparable experimental conditions. Moreover, PYR-induced alterations in vivo and in vitro were observed after using excessive exposure schemes as compared with the expected environmental levels in the general population (CDC, 2015; FDA, 2015; Morgan, 2012; Tulve et al., 2006). Most importantly, a relevant question that remains to be determined is the threshold concentration at which PYRs may damage astroglia-related cell types, potentially weakening glial mechanisms that contribute to optimal neuronal function.
The aim of the present work was to characterize the toxicological effects of individual PYRs and a quaternary mixture in C6 cells, using a comprehensive battery of biochemical and subcellular markers and extensive time-concentration-effect schemes. C6 cells keep many physiological features of astrocytes and have been extensively used to characterize pharmacological and toxicological responses to neuroactive substances (Alaimo et al., 2011; Benda et al., 1968; Cookson et al., 1995; Posada-Duque et al., 2015). The interaction between glial cells and neurons has been demonstrated to exert a major influence on the structural arrangement and functional output of neuronal circuits under physiological and pathological conditions (Lee et al., 2014; Zeidán-Chuliá et al., 2014). We found that C6 cells are vulnerable to nM levels of types I and II PYRs. In addition, the multiple subcellular anomalies observed at nM-µM levels imply that toxicogenic pathways unrelated to the primary MOA described in neurons were sensitive and reactive to PYRs.
MATERIALS AND METHODS
Reagents
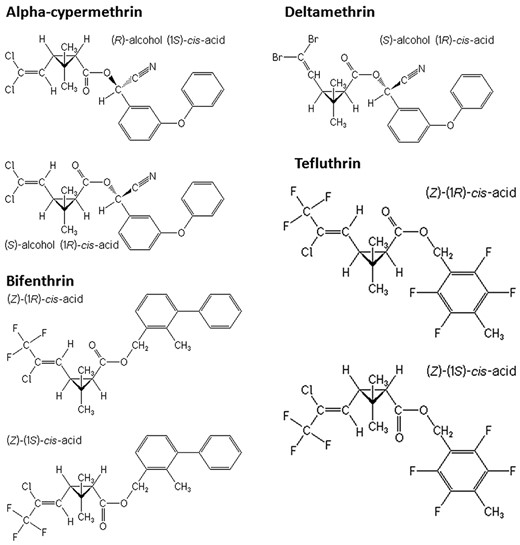
Molecular structures of the 4 pyrethroid (PYR) compounds studied. Source: http://www.alanwood.net/pesticides/index.html.
Cell culture
The rat C6-ATCC CCL-107 cell line was kindly provided by Dr Zvi Vogel (Weizmann Institute of Science, Rehovot, Israel). C6 cells are derived from an cerebral astrocytoma originally induced by exposure of Wistar-Furth rats to N,N′-nitro-methyl-urea (Benda et al., 1968). C6 cells were maintained in DMEM supplemented with 10% heat-inactivated FBS, 2.0 mM glutamine, 100 units/ml penicillin, 100 μg/ml streptomycin, and 2.5 µg/ml amphotericin B (Richet SA, Buenos Aires, Argentina). Cells were cultured at 37°C in a humidified atmosphere of 5% CO2 to 95% air.
The medium was renewed 3 times a week. For all experiments, C6 cells were removed with 0.25% trypsin, diluted with DMEM 10% heat-inactivated FBS, and replated into 12-well plates (1.5 × 10⁵ cells/well), 96-well plates (2 × 10⁴ cells/well), or 20 cm2 plate (2 × 10⁵ cells/plate) to yield 70% confluent cultures after 24 h (48 h in 20 cm2 plates). Then, cells were washed with PBS. A battery of biochemical and morphological analyses were carried out in C6 cells (see later). Three independent experiments were conducted, and experimental results are expressed as percent change observed after each treatment compared with control (mean ± SEM).
Assessment of cell viability by the MTT assay
The MTT assay was carried out to evaluate cell viability according to the protocol previously described (Mosmann, 1983) with slight modifications (Gonzalez et al., 2008). The MTT test is considered a sensitive procedure to inform on mitochondrial energy metabolism and structural integrity (Mosmann, 1983). Briefly, cell cultures were prepared in 96-well plates and exposed to PYRs (type-II like α-CYP and DM; type-I like BF and TF) for 4, 12, 24, and 48 h dissolved in 0.1% vol/vol dimethylsulfoxide (DMSO) vehicle in DMEM supplemented with 2% or 10% FBS. We further examined a quaternary mixture. The stock mixture comprised effective concentration (EC)15 levels of all single compounds (EC15 = concentration that causes a 15% decrease in response compared with vehicle-control cultures in 24-h exposure assays). Solutions were stirred and gently heated (approximately 40°C) to assure full solubility in cell culture medium. In the general population, taking into consideration environmental data (Morgan, 2012; Tulve et al., 2006; Wielgomas et al., 2013) and an efficient metabolism in mammals (Soderlund et al., 2002), levels of PYRs higher than 102 µM seem to be hardly plausible in target tissues. Accordingly, the final concentration of test chemicals in the culture medium ranged from 0.01 to 50 μM. The culture medium was removed after exposure. Cells were then washed twice with PBS pH 7.4, and 0.125 mg/ml of the MTT solution was added. After 2 h incubation, the reaction was stopped by addition of 200 µl DMSO/well. The MTT assay product was determined by measuring the absorbance at λ570nm with background subtraction at λ655nm in a Model 680 Benchmark microplate reader (BIO-RAD).
Assessment of cell viability by the NR assay
The NR assay was carried out following the protocol described by Alaimo et al. (2011). This cytotoxicity test is based on the ability of viable cells to incorporate the supravital dye NR in the conserved lysosomes. Following exposure for 24 h in DMEM supplemented with 2% FBS, cells were washed with PBS, and NR solution (50 µg/ml in DMEM) was added to each well. After 2 h incubation at 37°C, cells were first washed with PBS, and 200 µl of 50% ethanol/1% acetic acid solution was then added until complete dissolution. Absorbance was measured at λ570nm with background subtraction at λ690nm in a Model 680 Benchmark microplate reader.
Cell morphology
C6 cells (6 × 10⁴ cells/well) were grown on glass coverslips in 12-well plates. After exposure to PYRs for 24 h cells were washed twice with PBS and fixed with 4% paraformaldehyde/4% sucrose (PFA-S) in PBS for 20 min at room temperature (RT). Finally, cells were washed with PBS and mounted on glass slides. Cell morphology was evaluated using differential interference contrast (DIC) and bright field microscopy. Samples were examined using a Leica microscope (Reichert Polyvar, Austria). Total cell area was determined based on DIC pictures using the ImageJ software (Research Services Branch, National Institute of Heath [NIH]). Fifty cells were counted for each concentration evaluated. The average cell area value was expressed as % control ± SEM.
Analysis of mitochondrial membrane integrity and nuclear morphology by fluorescence microscopy
The mitochondrial morphology and membrane potential (Δψm) dissipation were analyzed according to Alaimo et al. (2014) by using MitoTracker Red CMXRos. This fluorochrome has been used to characterize physiological and chemical-induced programmed cell death processes involving structural and functional disruption of the mitochondrial network and oxidative stress (Gómez et al., 2007; Indo et al., 2007; Poot et al., 1997). Briefly, C6 cells (6 × 10⁴ cells/well) were grown on glass cover slips in 12-well plates. After 24-h exposure to EC15/10, EC15, and EC30/max levels of single-compound or mixture dilutions, as previously estimated in the MTT assays (Table 1), cells were washed twice with PBS. The cultures were then incubated with a live cell permeant, mitochondria-specific red fluorescent probe, MitoTracker Red CMXRos (λex: 544 nm; λem: 570 nm) at a final concentration of 35 nM in serum-free culture medium for 30 min at 37°C. After incubation, the cells were washed with PBS and fixed with PFA-S in PBS for 20 min at RT. The mitochondrial morphology was scored and classified according to Alaimo et al. (2011) as tubular (ie, +90% observations in DMSO-exposed control cultures), intermediate (ie, tubular mitochondria with swollen regions), and fragmented (ie, small and globular). Severely damaged mitochondria were those showing loss of Δψm. A total of 220 cells were counted for each concentration. For each mitochondrial shape class, data are expressed as percent cells compared with total cells counted (average ± SEM).
Estimation of Low-Effective Benchmark Concentrations for Cell Viability
| Insecticide | Benchmark Concentration Levels (µM) | Coefficients of Goodness of Fit | NOEC (µM) | Relative Potency Factor (RPF) | EC15, DM-Equivalent Concentration (µM) | ||
|---|---|---|---|---|---|---|---|
| EC15 | EC30/max | R2 | R2 Adj. | ||||
| α-CYP | 7.8 ± 1.1 | 30 | 0.94 | 0.90 | 1 | 0.64 | 5.00 |
| DM (index) | 5.0 ± 0.9 | 25 | 0.89 | 0.81 | 0.1 | 1 | 5.00 |
| BF | 16.1 ± 0.3 | 30.8 ± 1 | 0.99 | 0.98 | 5 | 0.31 | 5.00 |
| TF | 37.3 ± 2.3 | 50 | 0.87 | 0.75 | 5 | 0.13 | 5.00 |
EC15, EC30, and NOEC levels for cell viability assays were computed using mitochondrial metabolic activity as an endpoint (MTT test) in 24-h exposure assays. Although PYRs are poorly soluble in aqueous medium, there were a few assays for which EC30 was estimated beyond the concentration range examined. In these cases, ECmax levels (ie, the maximum concentration level examined) are informed instead of actual EC30s. R-squared (R2) statistical measures describing how close the data are to the fitted regression curves were high. In all cases, the goodness of fit was acceptable after computing adjusted R2 coefficients (R2 Adj.) to control for model overfitting. NOECs were estimated by 1-way ANOVA followed by Dunnet post hoc test. The RPFs were computed as the ratio of the EC15 of the most potent PYR (DM, considered as the index chemical) and the EC15 of each PYR. Thus, all compounds selected to construct the test mixture may be expressed in DM-equivalent concentrations.
The effect of PYRs on nuclear morphology was evaluated using Hoechst-33258 assays according to Gonzalez et al. (2008), with minor modifications. This fluorochrome is a water-soluble compound that has been long used as a sensitive DNA-specific dye in characterizations of chromosomal condensation and fragmentation events. Hoechst-33258-related blue fluorescence appears enhanced after chromosomal condensation. This assay has been used in studies of chemical-induced disruption of nuclear integrity (Elstein and Zucker, 1994; Kim et al., 1988; Labarca and Paigen, 1980), including assessments of rat brain astroglia damage after exposure to anticholinesterase insecticides (Guizzetti et al., 2005). DNA labeling with Hoechst-33258 should not be used as an unequivocal proof of chemical-induced genotoxicity according to Organisation for Economic Co-operation and Development (OECD) regulations.
C6 cells (6 × 10⁴ cells/well) were grown on glass cover slips in 12-well plates for 24 h. Then, cells were exposed for 24 h to individual PYRs (EC15/10, EC15, EC30, or ECmax, as previously estimated in the MTT assays, see Table 1), or to the quaternary mixture described in Section Assessment of Cell Viability by the MTT Assay, as stock and following serial dilutions 0.05×, 0.1×, and 0.2×. Then, cells were washed twice with PBS and fixed with PFA-S in PBS for 20 min at RT. Finally, cells were washed with PBS and stained with 1.5 mg/ml Hoechst-33258 for 10 min. Cells were washed with PBS and mounted on glass microscope slides. Normal and anomalous nuclear figures were classified based on morphological landmarks described elsewhere (Alaimo et al., 2011; Fenech et al., 2011). A categorical system was used to typify and count nuclear shapes as follows: normal, swollen (ie, ≥ 2.5 times larger than normal nuclei), elongated (ie, ≥ 2.5 times nucleus enlargement in 1 direction), bilobulated, micronuclei, fragmented, and nuclear buds. A total of 103 cells were counted in each single-compound assay. Results are expressed as percentage of each shape category related to total cells counted (average ± SEM). Samples were examined using a Nikon fluorescence microscope Eclipse E600 and TRITC filters (λex: 528–553 nm; λem: 600–660 nm). The images were captured by a Nikon CoolPix5000 camera (Nikon Instech Co, Japan). Digital pictures were analyzed using ImageJ software.
Data modeling
Data were analyzed using SigmaPlot software, v.10.0 (Systat Software Inc, California). Logistic 3-parameter modeling was used to estimate benchmark levels in MTT assays. EC15 and EC30 values were computed as concentration levels producing 15% and 30% decline in the MTT assay reaction product compared with the corresponding vehicle-control cultures, respectively. When EC30 could not be estimated, the maximum concentration examined of the indicated PYR (ECmax) was used as benchmark concentration. A default P value of .05 was used to test the goodness of fit.
Analysis of acidic vesicle organelles by fluorescence microscopy
The lysosomal compartment is the main site for degradation of a variety of macromolecules, including proteins, carbohydrates, nucleic acids, and lipids (Saftig, 2005). Fluorescence microscopy was used to study changes in the structure of acid vesicle organelles (AVOs) such as mergers or fissions. Briefly, C6 cells (6 × 10⁴ cells/well) were grown on glass coverslips in 12-well plates, and exposed for 24 h to the quaternary mixture of PYRs described in Section Assessment of Cell Viability by the MTT Assay. Then, cells were washed with PBS and stained with 200 nM LysoTracker Red DND-99 (Molecular Probes, Invitrogen) for 30 min at 5% CO2 and 37°C, under darkness. Samples were washed and fixed as described in Section Cell Morphology. Nuclear labeling was performed using Hoechst-33258 dye and examined under a fluorescence microscope (Olympus IX-81, Olympus Corp, Japan) as indicated in Section Analysis of AVOs by Fluorescence Microscopy. The diameters of AVOs were measured from digital pictures by using ImageJ software. Fifty cells were examined at each concentration (1000 acidic vesicles per concentration). The area of individual AVOs was measured as described in Gorojod et al. (2015). The results are expressed as mean (µm) ± SEM.
Statistical analysis
Statistical analyses were carried out by Student’s t test and ANOVA followed by Student-Newman-Keuls post hoc test. No observable effect concentration (NOEC) was estimated by 1-way ANOVA followed by Dunnet post hoc test. Pearson’s r correlation analyses were also carried out. A P < .05 was set as the criteria for statistical significance. All analyses were conducted using GraphPad Prism 4 software (GraphPad Sofware, San Diego, California). Digital pictures were assembled using Adobe Photoshop (8.0.1).
RESULTS
PYRs Induce Cytotoxicity
C6 cell morphology and viability assessments were carried out to identify relevant exposure levels for the characterization of PYR-induced damage at particular markers of cellular physiology. In a preliminary study using the MTT assay, we found no significant effects of 0.1% DMSO vehicle on cell viability. Besides, the increase in FBS from 2% to 10% final concentration caused a mild growth-promoting effect (data not shown). Accordingly, the culture medium was alternatively supplemented with 2% and 10% FBS in independent assays to analyze the influence of serum on cell susceptibility. C6 cell viability was examined after 4- to 48-h exposure to PYRs.
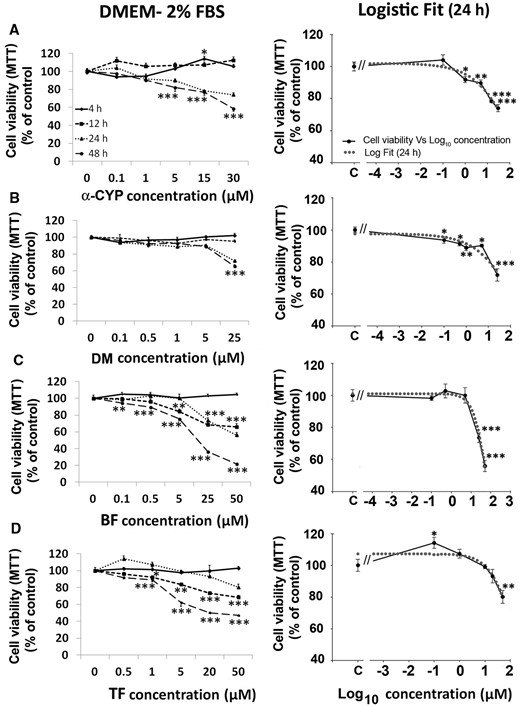
PYRs induce time- and concentration-dependent cytotoxicity. C6 cells were exposed to increasing concentrations of A, α-cypermethrin (α-CYP); B, deltamethrin (DM); C, bifenthrin (BF); and D, tefluthrin (0.1–50 μM) for 4–48 h in the presence of 2% fetal bovine serum (FBS), and viability was measured by the 3-(4,5-dimethyl-thiazol-2-yl)-2,5-diphenyl-tetrazolium bromide (MTT) assay. The results are expressed as percent control (mean ± SEM). Concentration-effect data were fit using logistic models (panels on the right). For the sake of clarity, statistical significance asterisks for 24 h experiments were omitted in the cell viability curves on the left, and are indicated in the logistic fit curves at right (24 h). For PYR-treated cultures compared with dimethylsulfoxide (DMSO) control (C): *P < .05, **P < .01, ***P < .001.
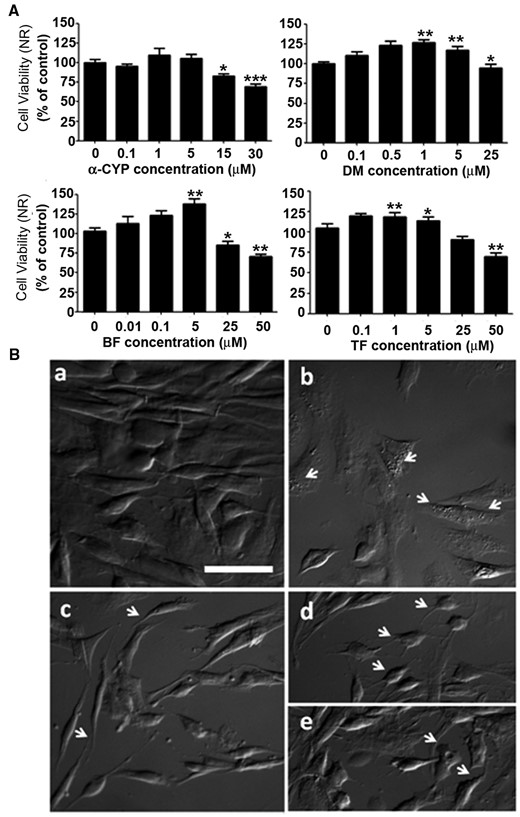
PYRs cause alterations in lysosomal integrity and cell morphology. Panel A, Cell viability was further determined using neutral red accumulation assays after 24-h exposure to PYRs. In general, activation of the lysosomal system was evident at low-µM levels, while a decline in response was observed at higher concentrations. Viability is expressed as % control, mean ± SEM. For pairwise comparisons between DMSO- and PYR-treated cells: *P < .05, **P < .01, ***P < .001. Panel B, differential interference contrast microscopy was used to evaluate morphological alterations in cell soma shape and processes. a, DMSO control; b, 30 µM α-CYP; c, 50 µM BF; d, 30 µM α-CYP; and e, 25 µM DM. Scale bar: 50 µm.
Cell morphology was also altered after 24-h exposure to PYRs. Figure 3 shows DIC microscopy findings in DMSO and PYR-treated cultures (Figs. 3B, microphotographs a and b–e, respectively). After exposure to PYRs, C6 cells presented an apparent increase in cytoplasmic vacuolization (see b), refined and retracted cell soma processes (see c and d), membrane lamellipodia (see e), and a higher frequency of round-like shapes. Loss of adhesion to the culture dish substrate was also observed (see b–e). Moreover, reduced cell area became evident at the higher exposure levels examined: for 30 µM α-CYP and 50 µM BF, 46% ± 3.3%, and 41% ± 2.8%, respectively (mean cell area decline ± SEM; P < .001).
Alterations in Nuclear Integrity
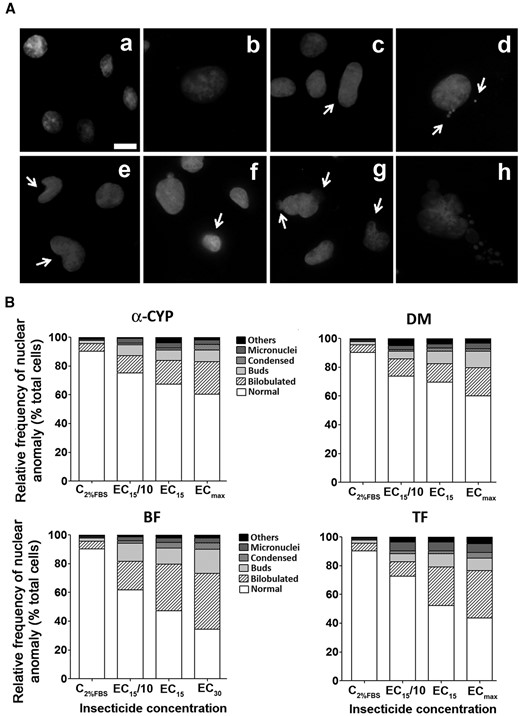
PYRs cause alterations in nuclear integrity. After 24-h exposure to PYRs, C6 cells were fixed, stained with Hoechst-33258 and analyzed by fluorescence microscopy. Panel A, In general, Hoechst-33258 accumulation was restricted to the nuclear region, depicted by a round shape in DMSO-treated cultures, ie, indicative of the normal C6 cell nuclear shape (see a). Nuclear aberrations were classified as follows: swollen (b), enlarged (c), micronuclei (d), bilobulated (e), condensed (f), nuclei with buds (g), and fragmented (h). Panel B, Relative frequencies of nuclear shape anomalies are expressed as % total cells counted. Less frequent anomalies (< 4%), such as swollen, enlarged, and fragmented nuclei, were jointly classified as “others.” Concentration-dependent increases in anomalous pyknotic shapes were evident at ≥ effective concentration (EC)15/10 (ie, a benchmark concentration for cell viability). Total number of nuclei observed per concentration = 1000.
Changes in Mitochondrial Integrity and Δψm Dissipation
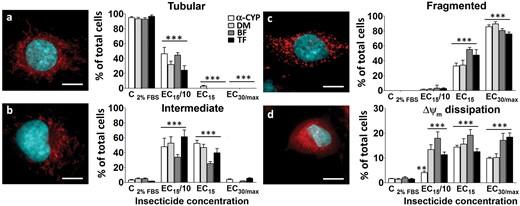
Effects of PYRs on mitochondrial network integrity. PYRs caused alteration of the mitochondrial network and membrane potential. Left: photomicrographs show nuclear and mitochondrial labeling with Hoechst-33258 and MitoTracker Red CMXRos dyes, respectively, after 24-h exposure to PYRs. The mitochondrial network structure was classified using a categorical system as follows: A, tubular; B, intermediate; C, fragmented; and D, dissipation of membrane potential. The total number of cells observed per concentration was 220. Scale bar: 20 µm. Right: frequencies of mitochondrial shapes are expressed as percent total cells of at least 3 experiments, mean ± SEM. Note that fragmented mitochondria increase in parallel to a decrease in tubular morphology. **P < .01, ***P < .001, for PYR-treated cultures compared with control (cells cultured in DMEM containing 2% FBS).
Moreover, the number of cells exhibiting Δψm dissipation was higher at most of the concentrations examined. Fragmented mitochondria were detected in approximately 90% of total cells at the highest exposure levels. These results demonstrate that 102–104 nM levels of PYRs may push the fusion/fission equilibrium toward mitochondrial fission, and that this effect is accompanied by Δψm dissipation. Interestingly, when ≥ EC15 levels for C6 cell viability (Figure 2) were used, the earlier mitochondrial findings cooccurred with increased rates of nuclear condensation (Figs. 4A, panels c and d and Figs. 8A and B, respectively). In fact, approximately 90%–95% of cells exhibited both Δψm dissipation and chromatin condensation. Moreover, inverse correlations (r = −0.95 to −0.99) between mitochondrial fission (ie, % cells with fragmented mitochondria) and cell viability (MTT assay, % control) were computed for all PYRs, suggesting some relationship between the structural and functional aspects examined with these mitochondria-related assays.
A Mixture of Sub-µM Levels of PYRs Causes a Decrease in C6 Cell Viability
We explored further whether the single-compound actions observed in C6 cells do cumulate as predicted by the dose-addition theory (Berembaum, 1985), under the assumption of a common primary MOA for PYRs (Soderlund et al., 2002).
MTT assays
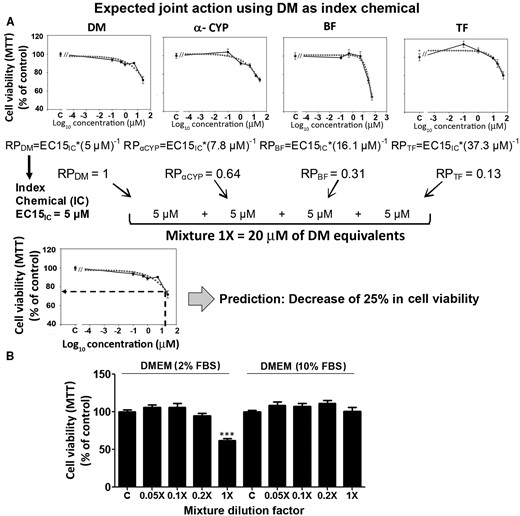
C6 cell viability after a low-level exposure to a mixture of PYRs. Panel A shows a schematic synthesis of the default hypothesis selection and testing process. Single-compound EC15 levels were estimated using MTT assay data (Figure 2 and Table 1). According to the default assumption and selecting DM as index chemical the stock mixture was expected to produce a 25% decrease in cell viability. Panel B shows the results of the MTT assays conducted after 24-h exposure to the PYR mixture. A decrease in cell viability at the highest mixture concentration was observed using 2% FBS (left chart). A 10% FBS supplement had a protective effect against PYR action. Viability is expressed as percent control, mean ± SEM. For comparisons between PYR-treated and vehicle-exposed cultures (DMEM 2% FBS): *P < .05, ***P < .001.
Figure 6B shows the effects of the test mixture in MTT assays using 2% and 10% FBS. The mixture caused significant concentration-related changes in cell viability (for the main effect of treatment, P < .01). An average 36.5% decrease in viability was observed at the highest concentration compared with the DMSO control (P < .0001) using 2% serum (Figure 6B). This decrease was 11.5% greater than the 25% expected a priori based on the DMIC equivalent concentrations of all PYRs combined in the stock mixture (compare theoretical vs empirical joint actions in Figs. 6A and B, respectively). The difference between C6 cells treated with a 0.2× mixture dilution (comprising 1.6 µM α-CYP + 1.0 µM DM + 3.2 µM BF + 7.5 µM TF) and vehicle-control cells was not statistically significant. Moreover, no changes in cell viability were observed after exposure to 1:10 and 1:20 mixture dilutions (Figure 6B). Last, 10% FBS completely abolished the decrease in viability induced by mixture 1×, consistent with the apparently protective effect of serum observed in single-compound assays.
Hoechst-33258 assays
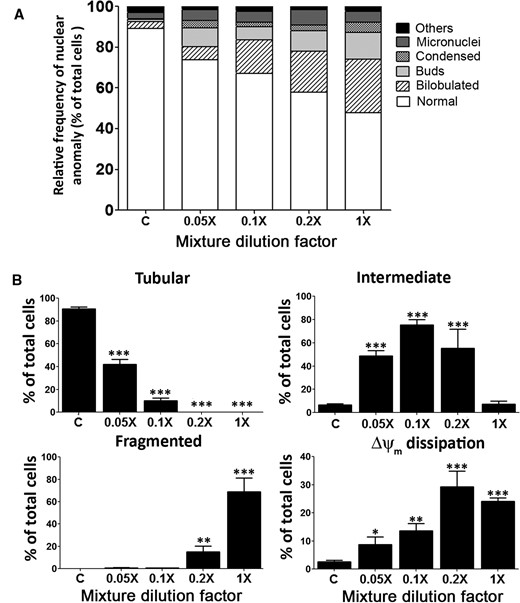
Joint action of the PYR mixture on nuclear and mitochondrial integrity. Panel A, Evaluation of nuclear morphology using Hoechst-33258 assays after 24-h exposure to the mixture. Panel B, Concentration-response relationships for mitochondrial integrity using MitoTracker Red CMXRos. See classification of mitochondrial network shapes in Figure 5 legend. Results are expressed as relative frequency of nuclear anomaly (% of total cells counted, mean ± SEM), from at least three independent experiments. For each mixture concentration, the total number of nuclei observed was 1000 for Hoechst-33258 assays, and 220 cells were examined for mitochondrial integrity assays. Statistical significance of differences between PYR-treated and DMSO control cultures (2% FBS): *P < .05, **P < .01, ***P < .001.
MitoTracker Red assay
As observed with single compounds, the mixture caused changes in the mitochondrial network structure and induced Δψm dissipation (Figure 7B). Increased rates of mitochondrial fission were evident. Furthermore, a decrease in the number of cells carrying preserved tubular network was observed at all test concentrations; even the lowest mixture level examined, 0.05×, caused a decrease of 50% ± 1.5% (F4,15 = 829.1, P < .0001). The presence of intermediate mitochondria was by far the most frequent morphological observation with 12-fold higher rate than in vehicle-exposed cells at 0.05–0.2× mixture levels (F4,16 = 14.6, P < .0001). This increase was not evident after exposure to the undiluted mixture (1×) which produced a high rate of fragmentation (175-fold compared with control; F4,12 = 254, P < .0001). Furthermore, an increased number of cells with Δψm dissipation was observed at all mixture concentrations, reaching a peak at a 0.2× level (ie, 12-fold increase; F4,13 = 27.2, P < .0001). Thus, the mixture caused a marked perturbation in the fusion/fission equilibrium of the mitochondrial network dynamics, extending the findings shown in Figs. 2 and 5.
LysoTracker Red DND-99 assays
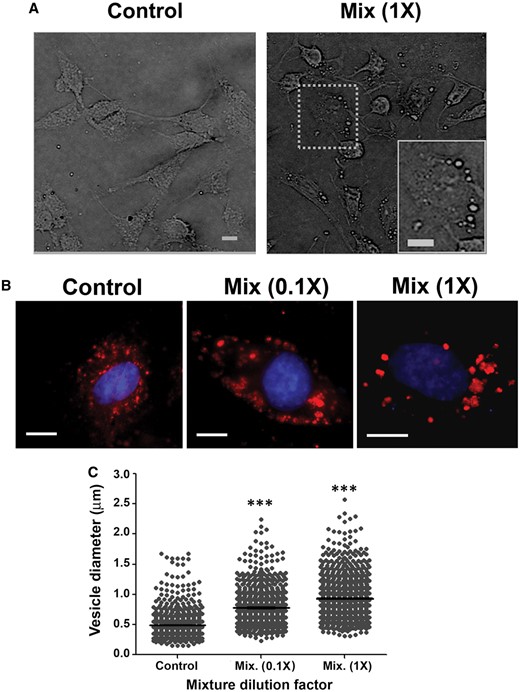
Cumulative action of the PYR mixture on acidic vesicle organelles (AVOs). Bright field microscopy and LysoTracker Red DND-99 staining were carried out after 24-h exposure to 0.1 and 1× mixture levels to evaluate PYR joint effects on AVOs. Panel A, Bright field microscopy analyses show alterations in the number of AVOs (see dotted line boxes in the microphotography). Panel B, C6 cells stained with LysoTracker Red DND-99 and costained with Hoechst-33258. All images represent merged fluorescent pictures. Panel C, Analysis of acidic vesicle diameters. Results are expressed in µm, mean ± SEM. Statistical significance of differences between PYR-treated and DMSO-treated cultures (2% FBS): ***P < .001. Scale bars = 10 µm.
DISCUSSION
In this work, we showed that exposure to PYRs for 24 h impairs C6 cell viability. Considering single-compound and mixture assays, threshold levels for PYR-induced alterations in morphological and functional integrity spanned the 101–104 nM range. Our results suggest that neuroglia-derived cells may be susceptible to physiological disruption after exposure to environmentally relevant levels of PYRs.
We found concentration-dependent adverse effects on the mitochondrial network architecture and function after single- (Figs. 2 and 5) and multiple- (Figs. 6 and 7) PYR exposure at 10−2–101 µM concentrations. PYRs decreased mitochondrial dehydrogenase activity, increased Δψm dissipation, and perturbed the fusion/fission equilibrium, ie, pushed the equilibrium toward mitochondrial fission. Noteworthy, a loss of typical tubular appearance in the mitochondrial network was even observed after simultaneous exposure to individual concentrations well below single-compound threshold levels for cell viability (compare Figs. 5 and 7 with Figs. 2 and 3). Moreover, for all PYRs tested, concentration-related changes in the number of viable cells at 24 h correlated with the disruptive effect on the fusion/fission equilibrium. In addition, time-concentration-response experiments (MTT assay) showed an earlier onset of effects (ie, at 12 h) with a significant decrease in cell viability after exposure to BF and TF concentrations ≥ 25 µM (Figure 2; compare with DM and α-CYP). In general, in rats, lethality occurs within 12 h after acute oral exposure to lethal doses of PYRs (Wolansky and Harrill, 2008), and BF and TF have lower threshold doses for lethality than DM, CYP, and α-CYP (WHO, 2010; Wolansky et al., 2006, 2007). Yet, the numerous differences between the in vitro conditions of our study and in vivo assessments after exposure to PYRs may hinder any comparison of viability impairment over time in C6 cells and lethality in laboratory animals.
Mitochondria are very plastic organelles, endowed with the ability to split as dispersed individual blocks or to arrange in complex interconnected networks displaying rapid shape interconversion (Bereiter-Hahn and Vöth, 1994; Sheridan and Martin, 2010). During mitosis as well as during apoptosis, the mitochondrial network is fragmented, resulting in a larger number of smaller mitochondria. In apoptosis, this phenomenon usually occurs before activation of caspases and the release of cytochrome c into the cytosol (Martinou and Youle, 2006). This enhanced fragmentation suggests a mechanistic link between changes in the mitochondrial network architecture and apoptosis. Consistent with this suggestion, we also observed alteration of Δψm dissipation (Figure 5), which has been proposed to be a key event in the intrinsic signaling pathway leading to apoptotic cell death after intracellular exposure to chemical stressors (Galluzzi et al., 2012). Braguini et al. (2004) examined the molecular actions of DM in mitochondrial fractions prepared from rat liver. Nanomolar levels of DM caused mitochondrial alterations in critical aspects of the organization of the membrane lipids, lipid-protein interactions relevant to oxidative phosphorylation, membrane permeability (ie, its Δψm potential), and mitochondrial volume. Furthermore, several studies have demonstrated the ability of PYRs to increase reactive oxygen species (ROS), and progressive oxidative stress following increased rates of ROS generation has been proposed to lead to cell death (Gupta et al., 2013; Liu et al., 2009; Romero et al., 2012, 2015; Srivastava et al., 2012). In turn, increased intracellular levels of ROS may induce the opening of the mitochondrial permeability transition pore (Mattson and Kroemer, 2003). A ROS-induced cell death pathway involving mitochondrial fission and Δψm dissipation has been proposed in C6 cells and cerebral astrocytes after exposure to manganese (Alaimo et al., 2011; Gonzalez et al., 2008). Studies of Maurya et al. (2012, 2016) reported overproduction of ROS, mitochondrial disruption, and cell death in cortical and hippocampal astrocytes after a 2-week daily oral exposure to CYP in weanling rats. Other in vivo studies in small rodents and in vitro studies in human cells are consistent with the occurrence of cytotoxicity in nervous system cells after exposure to PYRs, leading to astrogliosis, neuroinflammation, and apoptotic cell death in astroglia (Mense et al., 2006; Singh et al., 2011). However, most of these previous studies used exposure schemes with limited comparability (if any) to environmentally relevant scenarios of human exposure to PYRs.
In this study, low levels of PYRs were also effective to disturb the lysosomal compartment of C6 cells (Figs. 3A and 8). Lysosome vesicles make up a natural defense system engulfing and digesting potential chemical stressors. In our work, all PYRs except α-CYP induced a biphasic response of lysosomes (Figure 3A): an increase in NR retention at 100–101 µM concentrations and a decrease at higher concentrations. LysoTracker Red DND-99 assays further demonstrated that PYRs induced an increase in the size of AVOs in parallel to a decrease in the number of these vesicles (Figure 8B). Concentration-dependent increases in the amount and/or size of lysosome vesicles at low-level exposures may be interpreted as gradual stages of activation evolving to counteract the damaging actions of PYRs. Lysosomal activation has been proposed to contribute to cell death in astroglia after exposure to neurotoxic metals (Gorojod et al., 2015). In addition, a decrease in NR retention at above 101 µM may indicate exhaustion of lysosomal capacity under extreme cytosolic levels of PYRs (Saftig, 2005).
In addition, increased rates of nuclear anomalies were evident after 24-h exposure to PYRs, even at concentrations below the threshold level for cell viability (Figs. 4 and 7A). The most frequent alterations were bilobulated and condensed nuclei, followed by micronuclei and buds, all of which are fairly consistent with descriptions of DNA instability and DNA damage-related apoptotic cell death (Bolognesi et al. 2011; Fenech, 2002; Fenech et al., 2011). Our results are consistent with several studies in cultured cells (Çelik et al., 2005; Liu et al., 2009; Patel et al., 2006), mouse bone marrow (Bhunya and Pati, 1990), and fish erythrocytes (Simoniello et al., 2009), reporting greater rates of micronuclei, DNA fragmentation, and chromosome aberrations after exposure to several cyano- and noncyano-PYRs. Interestingly, most of these previous studies used much higher PYR concentrations, marking the sensitivity of C6 cells to the cytotoxic actions of PYRs. The molecular mechanism linking PYR exposure to DNA damage is presently unclear. The nuclear envelope microstructure has been proposed as a target site in ticks exposed to the PYR permethrin (Roma et al., 2013). Thus, our results call for a comprehensive battery of assays to characterize nuclear integrity in nervous system cells in vitro and in vivo after low-level exposure to PYRs, such as an immunohistochemical assessment of nuclear envelope microstructure, and micronuclei and comet tests.
The findings of this work raise a concern about the poorly explored PYR actions targeting physiological aspects other than the neuronal system of VGSCs long proposed as the primary target site for all PYRs regardless of their type (Narahashi, 2000; Soderlund et al., 2002). Types I and II PYRs cause distinctive neurobehavioral syndromes in vivo in adult rats, and this divergence is the most evident at high-effective oral doses (Weiner et al., 2009; Wolansky and Harrill, 2008). Extensive in vitro studies using Xenopus oocytes, rat brain synaptosomes, a neuroblastoma cell line, and a battery of electrophysiological and neurochemical endpoints are consistent with the canonical triple classification, ie, types I, II, and mixed I/II (Breckenridge et al., 2009). Yet, the mechanistic divergence causing the proposed common-mechanism types would be hardly accounted by PYRs solely acting on the neuronal VGSC system (Aschner, 2000). In the context of characterizing PYR actions in nervous system cells, C6 cells have the advantage of having many morphological, functional, pharmacological, and toxicological features of astrocytes (Benda et al., 1968; Cookson et al., 1995; Posada-Duque et al., 2015) but own a poor (if any) expression of VGSCs (Munson et al., 1979; Sontheimer, 1994; Wang et al., 1992). Furthermore, Hales and Tyndale (1994) reported that C6 cells do not present a functional GABAA receptor-mediated signaling, which hinders any attempt for a comparison of our work with the action of GABAergic drugs on PYR effects in rat brain synaptosomes published by Crofton and Reiter (1987). Neuronal voltage-gated calcium channels are also proposed to be relevant as alternative target sites accounting for type-I/type-II divergence in neurological effects (Shafer and Meyer, 2004; Soderlund et al., 2002). In primary cultures of mouse cortical neurons, 101–102 nM BF (ie, a concentration range found to be suprathreshold in our work), has been shown to be effective to alter synchronous calcium oscillations (relevant for cell morphology phenotype) with independence of actions on VGSCs, and apparent participation of signaling mediated by glutamate NMDAR receptors (Cao et al., 2014). Although the EACC1 subtype of glutamate transporter is endogenously expressed and functional in C6 cells (Sims et al., 2000), it remains to be established if glutamate-related pathways played a determinant role in our work. In addition, C6 cells present a remarkable mitochondrial sensitivity to peripheral benzodiazepine (PBD) receptor ligands: exposure to nM levels of PBD-like ligands causes a sequence of proapoptotic events similar to that observed in our work with all PYRs, including morphological restructuring of the mitochondrial network, increase in mitochondrial membrane potential dissipation, and apoptotic-like cell death (Chelli et al., 2004; Shiraishi et al., 1991). Whatever the mechanism by which PYRs caused severe damage to C6 cell viability and nuclear integrity in a concentration-related manner, this mechanism would hardly involve the voltage-gated ion channels and receptor systems of neurons classically postulated as target sites for common and type-specific actions of PYRs in the nervous system.
In the light of the sensitivity of C6 cells in single-compound assays, ie, demonstrating harmful actions at low-µM levels, we then explored the cumulative action of nM levels of multiple PYRs. PYRs have been proposed to have a similar primary MOA in neurons (Soderlund et al., 2002). All the preparations of PYRs examined, except DM, were not classified using the type-I/type-II and T/CS canonical systems proposed approximately 35 years ago (Soderlund et al., 2002). In addition, those classical studies of PYRs in laboratory animals were conducted using intravascular and intracerebroventricular routes, ie, not the oral gavage intubation that carries more relevance for humans. The studies using oral dosing and young adult rats indicate that DM causes a type-II, CS-like syndrome, and that BF causes a type-I, tremorigenic syndrome (Crofton and Reiter, 1984; Wolansky et al., 2007). More recently, Weiner et al. (2009) conducted a comprehensive functional observational battery study that further supports a type-I like classification of BF and TF and a type-II classification of DM. α-CYP has never been classified using a battery of neurobehavioral measures after oral exposure in rats, although all studies of racemate preparations of CYP consistently indicate that this compound produces typical type-II, CS-syndrome signs of toxicity (Weiner et al., 2009; Wolansky and Harrill, 2008). Thus, the 4 compounds examined in our work represent the toxicological heterogeneity of PYRs to a great extent (Wolansky and Harrill, 2008). At the time of designing our study, a few reports had suggested dose addition as a plausible hypothesis for the joint actions of PYRs in nervous system cells. Cao et al. (2011) reported dose-additive actions of PYRs on VGSC inward sodium influx in primary cultures of cerebrocortical neurons. In addition, 2 in vivo studies in adult rats using low-level acute oral exposures and neurotoxicity as an endpoint strongly suggest that PYRs act jointly as predicted by the dose-addition theory (Marshall et al., 2013; Wolansky et al., 2009; Wolansky et al., unpublished data). In the present work, the stock mixture caused potential nonadditive effects on cell viability, and 0.05–0.2× mixture dilutions (ie, mostly consisting of 10−1–101 µM levels shown to be subeffective in single-compound assays) were likewise subthreshold in MTT assays (Figure 6B). Yet, confirmation or rejection of additivity will require a selection of test mixture levels, mathematical modeling, and statistical testing protocols specifically designed to test cumulative actions under a similar in vitro coexposure scenario. Thus, we are not able to statistically compare the expected and experimental results obtained with the stock mixture in MTT assays (Figs. 6A and B, respectively). If the empirical 36.5% decrease in cell viability were not statistically different from the theoretically estimated 25%, then the MTT assay results would be potentially consistent with the additive effects of a mixture of PYRs recently reported by Romero et al. (2015) using different cell culture systems and oxidative stress assays, and by Johnstone et al. (2016) using a primary cortical network of neurons and glia as an in vitro experimental system, and spontaneous mean network firing rate as an endpoint. Noteworthy, when the same mixture level scheme (0.05–1× range) was examined using Hoechst-33258, MitoTracker Red CMXRos, and LysoTracker DND99 fluorescent dyes informing on nuclear integrity, mitochondrial network structure, and lysosomal status, threshold concentrations for C6 cell damage were observed at 10- to 100-fold lower levels than in MTT assays. It remains to be elucidated which mechanisms are operative to cause the earlier mentioned patterns of joint effects.
Our work and previous studies warn on the progressive damaging actions that PYRs may exert on nervous system cells at exposure levels below those producing evident clinical signs of acute toxicity. Astrocytes contribute to establishing structural bridges and signaling pathways in the nervous system, being able to modulate short- and long-term physiological and pharmacological responses in neurons, and to generate cytosolic calcium waves after neurotransmitter-mediated synaptic activity (Eroglu et al., 2008; Navarrete and Araque, 2014; Sofroniew and Vinters, 2010). More recently, it has been shown that astrocytes participate in learning and memory processes (Lee et al., 2014). Threshold PYR exposures for disruption of neuronal excitability in rat dorsal root ganglion neurons extend over an approximately 10−1 µM range (Tabarean and Narahashi, 1998). Furthermore, several studies have reported cardiovascular, endocrine, and developmental alterations after exposure to 0.1–50 µM PYR levels (DeMicco et al., 2010; Du et al., 2010; Go et al., 1999; Kojima et al., 1988; Nishimoto et al., 1987; Pine et al., 2008; Spencer et al., 2001). The fact that low-nM concentrations of PYRs in the test mixture were disruptive of various critical indicators of C6 cell survival warns of the potential harmful effects of low-dose exposures to PYRs. This study using a cell line with an astrocytic lineage calls for future research efforts to determine to what extent the low-dose levels of PYRs may exacerbate chronic nervous system disorders caused or influenced by aberrant neuron-glia interactions.
In conclusion, we found that single- or multiple-compound in vitro exposure of C6 cells to ≥ 101 nM levels of modern PYRs may cause adverse alterations in several homeostatic systems of cell physiology, promoting activation of signaling landmarks of apoptotic cell death. We describe these low-dose effects in astrocyte-like cells. Importantly, pharmacological and toxicological actions of PYRs in neuroglia have been mostly investigated at concentrations irrelevant to the health risks of these insecticides in humans. Thus, our work adds novel evidence on the vulnerability of the nervous system to sub-µM levels of PYRs.
ACKNOWLEDGMENTS
M.J.W. wants to express his gratitude to W. Kobel, S. Allen, C. Breckenridge, T. Pastoor, and F. Suarez, from Syngenta Crop Protection Inc, for a donation of scientific equipment used in this study.
FUNDING
This work was funded by grant PICT-2007-1340, National Agency for Promotion of Science and Technology (ANPCyT), and PIP 0356, CONICET. Argentina Ministry of Science and Technology. M.J.W. is an Argentina National Research Council (ARG NRC) scientist and University of Buenos Aires (UBA) professor. M.L.K. is an ARG NRC scientist. The ARG NRC through its office of doctoral programs funded the research fellow positions of D.M.R. and B.G.B. at UBA School of Science, Department of Biological Chemistry.
REFERENCES
Center for Disease Control and Prevention (CDC). (2015). Fourth National Report on Human Exposure to Environmental Chemicals. US Department of Health and Human Services. Available at: http://www.cdc.gov/biomonitoring/pdf/fourthreport_updatedtables_feb2015.pdf.
Author notes
Present address; Institut du Fer á Moulin, INSERM UMRS 839, Paris, France; Sorbonne Universités, Université Pierre et Marie Curie, Paris, France.
These authors contributed equally to this study.

Comments