Three Pillars to Sustainable Growth and Development in India - Pillar I
•
1 like•1,635 views

Pillar I: Empowering the Population Through Streamlined Industrialisation and Modernisation

Recommended
Recommended
More Related Content
What's hot
What's hot (18)
Viewers also liked
Viewers also liked (10)
Similar to Three Pillars to Sustainable Growth and Development in India - Pillar I
Similar to Three Pillars to Sustainable Growth and Development in India - Pillar I (20)
More from Kyna Tsai
More from Kyna Tsai (20)
Recently uploaded
Recently uploaded (20)
Three Pillars to Sustainable Growth and Development in India - Pillar I
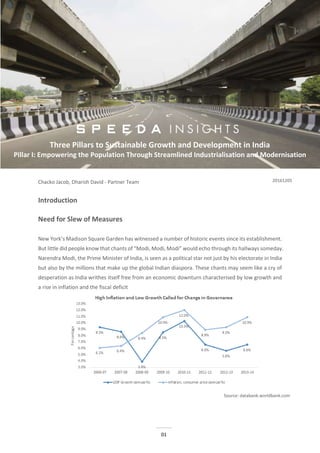
- 1. 01 Three Pillars to Sustainable Growth and Development in India I. Empowering the Population Through Streamlined Industrialisation and Modernisation Dharish David and Chacko Jacob - Partner Team Introduction Need for Slew of Measures New York’s Madison Square Garden has witnessed a number of historic events since its establishment. But little did people know that chants of “Modi, Modi, Modi” would echo through its hallways someday. Narendra Modi, the Prime Minister of India, is seen as a political star not just by his electorate in India but also by the millions that make up the global Indian diaspora. These chants may seem like a cry of desperation as India writhes itself free from an economic downturn characterised by low growth and a rise in inflation and the fiscal deficit Source: databank.worldbank.com Three Pillars to Sustainable Growth and Development in India Pillar I: Empowering the Population Through Streamlined Industrialisation and Modernisation 20161205
- 2. 02 Three Pillars to Sustainable Growth and Development in India I. Empowering the Population Through Streamlined Industrialisation and Modernisation Growth had fallen to a low of 4.4% in 2013 and inflation was nudging towards 10%. The rupee had devalued by as much as 27% between 2010 and 2013 (yearly average) and this added to the pressure on the current account deficit which touched a historic high of 6.7% of GDP in 2012. Manufacturing, which makes up 75% of the IIP (Index of Industrial Production) fell 0.7% at the start of 2014 while the index itself remained flat during the period, after falling for much of the financial year. Clearly, the country had been engulfed in a vicious cycle where consumers were spending less and businesses were reluctant to manufacture more than required. Most people would argue that it was under the UPA (United Progressive Alliance) that the country witnessed high growth rates of 8.5% and 10.5% in 2009 and 2010 respectively. But a bird’s eye view of the period would show that the growth was superficial, having been bolstered by rising government expenditure, which grew 123% from 2007-08 to 2012-13. What is more alarming is the decline in the ICOR (incremental capital output ratio) which fell from 4 to 7 from FY2004 to FY2014. It is safe to assume that the policy paralysis that the UPA government experienced in its second term nearly hurled the country back to the 1991 crisis. Therefore, it is no surprise that the sentiments of the people resonated well with Modi’s manifesto, electing him to office with a comfortable majority. Source: data.gov.in
- 3. 03 Three Pillars to Sustainable Growth and Development in India I. Empowering the Population Through Streamlined Industrialisation and Modernisation The Three Pillars The need for a reform agenda was imperative and the NDA manifesto was aimed at achieving precisely that. Since taking office, Modi and his team have been actively pushing for the introduction of various policies to reignite the economy. We would like to highlight the policies that we believe will not just add growth to the economy but also sustain it. In doing so we would like to assess the feasibility of these policies in the long run and their performance since implementation. Over the last year, Indian newspapers have carried headlines such as those below: “India replaces China as top FDI destination in 2015” “Shinzo Abe’s bullet train brings nuke, defence tech to India” “Cities of the future? Indian PM pushes plan for 100 ‘Smart Cities” “175 million new bank accounts in India in three years: World Bank” The underlying message from the above is that India’s efforts to improve the following three realms seem to be paying off: Source: Visualised by Speeda We believe that the right mixture for sustainable growth includes polices from the above three areas. In simple terms, the government aims at attaining sustainable growth rather than rapid growth which was witnessed during the UPA’s reign. Parag Khanna in his book “Connectography: Mapping the Future of Global Civilisation” argues that the paramount measure of power in the 21st Century is connectivity and establishing supply chains is the key to saving the many bottom billions. Governments have been targeting industrial development, urban planning, setting up of SEZs (Special Economic Zone) and opening up trade, FDI, improving financial inclusion and the digital economy. Over the past two years India has been going down this path and the benefits are slowly taking shape. To bring out the best out of its policies, the NDA has restructured the stance of previous governments by setting up the NITI Aayog to redefine the relationship between Centre and State.
- 4. 04 Three Pillars to Sustainable Growth and Development in India I. Empowering the Population Through Streamlined Industrialisation and Modernisation A policy of “Minimum Government, Maximum Governance” aims to reduce the government’s role in the industrial and service sectors and instead become an enabler, allowing states to play an active role in promoting economic growth. The NITI Aayog will replace the Planning Commission and act as an advisory body and policy think tank while providing a platform for interdepartmental coordination. Ahead in the series we will dig deeper into the policies and the effects both long term and short term. We have plotted an economic calendar highlighting important polices that have already been implemented and will enunciate later on the ones that will be introduced. It will also be of interest to understand the status of the economy as a whole from two periods – Past and Present and we have endeavoured to provide you an analysis of its future. Series Summary The series is divided as per three different policies and aims to delve deep into each of them. I. Empowering the Population through streamlined Industrialisation and Modernization Here we shall analyse the policies implemented or being implemented by the government to promote physical infrastructure growth. We will take a closer look at the National Manufacturing Policy and Make in India initiative to develop industrial corridors which will also act as global production networks. A breakdown of the New Foreign Trade Policy and Invest India which seeks to double India’s trade in five years. Also, will opening the industries to foreign investments maintain India’s status as a top FDI destination? II. Digital India: Road to boosting GDP by USD 1 trillion The 9 pillars of Digital India and its economic, environmental and social impact. An analysis of the channels to digital inclusion and why encouraging creative destruction is vital to its implementation. We will also look into the Smart City scheme and how it will help shape the urban landscape. III. Financial Inclusion and Seamless Payments through Development of Financial Infrastructure We break down the J-A-M trinity and assess its impact on the critical dimensions of branch, credit and deposit penetration. Examine how similar policies have worked in other countries. And finally, we look into how payment banks aim to transition India into a cashless economy
- 5. 05 Three Pillars to Sustainable Growth and Development in India I. Empowering the Population Through Streamlined Industrialisation and Modernisation Indian Policy and Economic Events – 2015/2016 Source: Compiled by Uzabase Though only the more important events are highlighted it is still evident that the government is running on all cylinders to deliver on the promises made before the election. As the Modi government crossed its two year mark on 26th May 2016, the review of his report card was mixed. Sceptics continue to believe that Modi isn’t the radical reformer that most people thought him to be. On the other hand, the Indian economy has indeed been doing better than most other countries. If the government is able to maintain this pace during FY16-17, it will have left a track record of being the government with the most successful first three years in office since 1996. Performance of Successive Governments since the 1990s Year GDP Growth (%) CPI Inflation (%) India Emerging Markets India Emerging Markets FY99-FY04 (BJP) 5.9 2.4 5.4 4.2 FY05-FY09 (Congress) 8.0 5.4 5.7 4.2 FY10-FY14 (Congress) 7.5 3.7 9.8 3.6 FY99-FY00 (BJP) 6.3 3.6 3.6 4.0 FY05-FY06 (Congress) 8.6 5.7 3.9 3.6 FY13-FY14 (Congress) 6.1 3.8 9.7 3.2 FY14-FY15 (BJP) 7.2 3.1 5.9 4.1 FY15-FY16 (BJP) 7.3 2.9 5.4 3.5 Source: WEO Database, IMF
- 6. 06 Three Pillars to Sustainable Growth and Development in India I. Empowering the Population Through Streamlined Industrialisation and Modernisation It is evident from the below that the government has experienced some momentum under Modi. The Associated Chambers of Commerce and Industry of India has given a 70% rating to the government while stating that the overhaul is a work in progress, benefits of which will be reaped before and after the end of Modi’s term. The new policies aim to provide a multiplier effect on downstream sectors. For example, under physical infrastructure we will discuss in detail how the “Make in India” campaign will create jobs in the manufacturing sector in micro and small and medium scale industries, increase the flow of foreign investments and develop skills and competitiveness in the manufacturing sector. Most Economic Indicators are in the Green Year ended 31st March, 2014 Indicators Year ended 31st March, 2016 6.60% GDP Growth 7.60% 9.46% Avg. Consumer inflation 4.91% -9.40% USD/INR movement -5.70% 18.70% Sensex performance -9.40% -0.10% Industrial growth 2.40% 4.40% Fiscal Deficit (% of GDP) 3.90% $24.3bn FDI $40.0bn 4.20% FOREX growth 5.40% 4.00% Exports growth -15.91% Sources: RBI, GOI, data.gov.in
- 7. 07 Three Pillars to Sustainable Growth and Development in India I. Empowering the Population Through Streamlined Industrialisation and Modernisation I. Empowering the Population Through Streamlined Industrialisation and Modernisation Defining The Sector That is Going to Bolster India's Growth “The combination of the world’s factory and the world’s back office will produce the most competitive production base” – Xi Jinping In India, the services sector continues to lead the economy not only in terms of sectoral composition but also in terms of growth rates. The industrial sector though has never been able to match the growth in the services sector. The nominal GDP sector composition data compared to China for 2014 is outlined below: Country Agriculture Industrial Services India 17.4% 25.8% 56.9% China 9.1% 42.6% 48.3% Source: WorldBank, World Development Indicators, accessed June 2016 The onerous task of accelerating industrial development has fallen on successive governments and this they have tried to achieve through establishing economic zones and clusters to integrate with global production networks. With a young population and an overcrowded job market it is imperative to give importance to this sector to boost employment. More importantly, 80% of the global trade is in goods and the rest in services. Schemes like Make in India will help a country which runs perpetually on a trade deficit, become self-sufficient and a hub for multi-national corporates to establish their businesses. The DIPP (Department of Industrial Policy and Promotion) that was established in 1995 has been crucial in promoting and regulating industrial growth and production in India. The Modi government plans to open up the Indian Manufacturing Sector to global production networks through a slew of policies, namely through the revised National Manufacturing Policy and the Make in India initiative. Focusing on manufacturing has traditionally been the strategy followed by most Asian power houses in their path to development. India should not take the Chinese president’s quote seriously because the services sector is no guarantee to development. In the past ten years from 2015, though services trade has been in surplus, it could only cover 20% of the trade deficit in goods. With the new policies the government would continue to hope that the industrial sector growth would eventually surpass services and also become a major contributor to GDP.
- 8. 08 Three Pillars to Sustainable Growth and Development in India I. Empowering the Population Through Streamlined Industrialisation and Modernisation Source: Niti Ayog/Planning Commission 2015 National Manufacturing Policy Instruments Needed to Raise Manufacturing Contribution to GDP to 25% In 2011, the UPA government released the National Manufacturing Policy seeking to boost growth in the manufacturing sector. The target was to increase the contribution of manufacturing to 25% by 2022 from the stagnant 16% since the 1980s. This was partially aligned along the success of industrialization among many emerging countries that had adopted this development strategy much earlier. East Asian countries, including China, Taiwan and South Korea had focused on promoting the manufacturing sector and handholding many industries especially at their early stage of development. India sought to replicate these policies in its industrialization strategy. The policy broadly sought to provide over 100 million jobs over a decade and address issues with regards to allowing flexible labor rules, simplifying business regulations through a single-window system, simpler and faster exit mechanisms and setting up industrial corridors and upgrading technology through a dedicated fund. National Investment and Manufacturing Zones (NIMZ) were proposed to capture the benefits arising out of clustering manufacturing activities along different corridors across the country. The Central Government creates the enabling policy framework and provides incentives while they worked in partnership with the States. The Central Government provided framework for infrastructure development on a Public Private Partnership (PPP) basis through appropriate financing instruments and State Governments were encouraged to adopt the instruments provided in the policy.
- 9. 09 Three Pillars to Sustainable Growth and Development in India I. Empowering the Population Through Streamlined Industrialisation and Modernisation National Investment and Manufacturing Zones (NIMZ) are an essential instrument of this Policy. NIMZ are zones that were conceived as large integrated industrial townships with state-of-the-art infrastructure. According to the government, land use was on the basis of zoning, while clean and energy efficient technology was to be prioritized with necessary social infrastructure including skill development facilities to provide a conducive environment for manufacturing industries. The minimum size of each zone would be 5,000 hectares (50 square kilometres) wherein the processing area has to be at least 30% of the area. By 2015, a total of 12 NIMZs were granted in-principle approval outside the DMIC (Delhi Mumbai Industrial Corridor) region. The Technology Acquisition and Development Fund (TADF), as envisaged in the National Manufacturing Policy, was set up in November 2015 to provide the funding specific to acquisition and development of clean and green technologies. The fund is expected to support, via subsidies, the manufacturing of equipment and machines for controlling pollution, reducing energy consumption and improving water conservation. The programme for Industrial Infrastructure Development-Modified Industrial Infrastructure Upgradation Scheme (IIUS) was originally launched in 2003 to enhance the competitiveness of domestic industry by providing quality infrastructure through public private partnerships in selected manufacturing clusters. Based on an evaluation in December 2011, a modified version of IIUS viz. ‘Modified Industrial Infrastructure Upgradation Scheme (MIIUS)’ was put in place since July 2013. Under MIIUS, projects can be undertaken to upgrade infrastructure in existing Industrial Parks and Estates. Greenfield Projects in backward areas and the North Eastern Region (NER) can also be sanctioned under the scheme. Projects are to be implemented by the State Implementing Agency (SIA) of the State Government. 26 projects were granted ‘in-principle’ approval under MIIUS. Final approval has been accorded to 17 Projects with central grants amounting to INR 4.27 billion and the remaining 9 projects with central grants of INR 2.55 billion were at the ‘in-principle’ approval stage. By March 2015, Central assistance of INR 813.5 million was released to 11 projects under the MIIUS. The Union Finance Minister, in his Budget Speech in 2014, announced the National Industrial Corridor Development Authority (NICDA), for the development of new industrial and economic corridors identified by the Government of India. The NICDA is still under the process of constitution, though many of the corridors have been identified.
- 10. 10 Three Pillars to Sustainable Growth and Development in India I. Empowering the Population Through Streamlined Industrialisation and Modernisation The Department of Industrial Policy and Promotion currently monitors the performance in the industrial sector by collating information on Industrial Entrepreneurs Memorandum (IEM), Industrial License, Letter of Intent (LOI), Foreign Investment data and industrial production returns. The Department also compiles and prepares an index of production of 8 core infrastructure industries on a monthly basis. Besides, the Department publishes the monthly Wholesale Price Index (WPI), which forms the basis for official information on inflation. Incentives offered by the National Manufacturing Policy Transfer of Assets -Transfer of assets of sick units will be facilitated by the company managing the respective NIMZ -Capital gains taxation will be relaxed on the sale of plant and machinery if the amount is re- invested in the same or other NIMZ in 3 years Green technology and Practices - 5% interest reimbursement and 10% capital subsidy for production of equipment that controls pollution, reduces energy consumption and conserves water - Incentive of INR 200,000 to Green Buildings under IGBC/LEED or GRIHA - Incentives for renewable energy under existing schemes Technology Development - SMEs to be given access to patent pool and/or part reimbursement of technology acquisition costs up to INR 2 million Benefits to SMEs - Rollover relief from long term capital gains tax to individuals on sale of residential property in case of re-investment - Tax pass through for VCs focusing on SMEs in manufacturing - Liberalisation of IRDA guidelines for investments by Insurance companies - Setting up of stock exchange for SMEs Industrial training and skill upgradation measures - Skill development of minimally educated workforce - Vocational and skill training through ITI in PPP mode - Establishment of instructors' training centre in each NIMZ Exit Mechanism - Alternate exit mechanism through job loss policy and a sinking fund Source: makeinindia.com, compiled by Uzabase The underlying concern with any new business entering India is navigating the complex regulatory framework. The National Manufacturing Policy aims to overcome this issue with a number of proposals. First and foremost, timeliness will be defined for all clearances. Units located in NIMZ will have a single window clearance. Process of clearances by centre and state authorities to be progressively web-enabled. Submission of multiple returns for different departments will be replaced with a simple consolidated monthly/quarterly return. Mechanisms for the cooperation of public and private institutions with government inspection services under the overall control of statutory authorities to be developed. Key Challenges to Successful Implementation In order to successfully implement the policy, the below issues need to be addressed.
- 11. 11 Three Pillars to Sustainable Growth and Development in India I. Empowering the Population Through Streamlined Industrialisation and Modernisation Physical Infrastructure Deficit Though India has relatively good road density, only 50% of the total roads in India are paved. The average speed of transport vehicles on highways is only 35-40kmph which is one of the lowest in the World. However, 57% of goods continue to be transported via roads rather than by rail or air freight. Though India fares better than most East Asian countries in terms of volume of goods transported by rail (0.9 million tonnes per 1000 people), it is still considerably behind China (1.9) and developed countries (2.2). Only 75% of the people have access to electricity in India, compared to nearly 100% in China and other developed countries. Electric transmission losses reflect the inefficient technology in place and the unauthorised use from the network grid. India’s electricity grid is considered to be one of the weakest and considering that China’s per capita consumption is about 5x times India’s, India still has a long way to go. Land Acquisition The baton charge on protesters against the acquisition of land in West Bengal was widely aired across India, creating jitters in the investment community, both domestic and international. This was an eye opener to the obsolete and complex land rules that are still followed in India. Environmental Clearance The gestation period for a new mine is 2-3 years from the date of acquisition through an open-bid. One of the primary reasons is obtaining clearances from the Environmental Ministry. World Bank Report 2016: Ease of Doing Business Starting a Business India South Asia Total number of procedures to register a firm 12.9 7.9 Total Number of days required to register a firm 29 15.7 Minimum Paid-In Capital (% of income per capita) 0.0 0.2 Source: World Bank’s Doing Business Report It does come as a surprise to most that the best regional performer in South Asia for minimum procedures and time to open a new business is Afghanistan, 3 procedures and 5 days respectively. Proposed Corridors Under National Manufacturing Policy These are the major industrial corridors to be developed across the various regions of the county. These are mega infrastructures that will promote industrial corridors and manufacturing jobs. Major Industrial Corridors in India, Currently Under Development
- 12. 12 Three Pillars to Sustainable Growth and Development in India I. Empowering the Population Through Streamlined Industrialisation and Modernisation Corridor Plan and States Covered Current Status States Involved Delhi Mumbai Industrial Corridor (DMIC) MOU signed between the Government of India and the Government of Japan on December 2006. The project will run along the Western Dedicated Freight Corridor (DFC) of the railways. DMIC Development Corporation (DMICDC) incorporated in 2008, as the implementing agency for the project. DMICDC is 49% equity of GOI, 26% equity of the JBIC and the remaining held by government financial institutions. “Japan Plus” to facilitate and fast track investment proposals from Japan. Uttar Pradesh, Haryana, Rajasthan, Madhya Pradesh, Gujarat and Maharashtra Chennai Bengaluru Industrial Corridor (CBIC) The Prime Ministers of India and Japan in 2011 expressed interest in the infrastructure development between Chennai and Bengaluru. Preparation of the Comprehensive Integrated Master Plan for CBIC is underway. (JICA) Study Team undertook the Preliminary Study and 2015 with Comprehensive Integrated Master Plan for Chennai- Bengaluru Industrial Corridor (CBIC) and a total 25 priority projects across various sectors have been aimed at removing infrastructural bottlenecks. Runs along the states of Tamil Nadu, Karnataka and Andhra Pradesh Bengaluru- Mumbai Economic Corridor (BMEC) In 2013, the Prime Ministers of the UK and India showed interest in cooperating for the development of a new Bengaluru Mumbai Economic Corridor. DMICDC and UK Trade and Investment (UKTI) have been identified as the nodal agencies for this project. DMICDC appointed M/s Egis India Consulting Engineers in JV with IAU ile-de-France & CRISIL Risk & Infrastructure Solutions Limited as consultants for a feasibility study. Karnataka and Maharashtra Vizag- Chennai Industrial Corridor (VCIC) A concept note prepared by the Asian Development Bank (ADB) on the East Coast Economic Corridor (ECEC) linking Kolkata – Chennai - Tuticorin and the feasibility study is being conducted with the help of the ADB Regional Perspective Planning of VCIC is in progress for the corridor. Department of Economic Affairs has accorded approval of a project loan of USD 500 million and ADB to provide a loan of USD 125 million for the proposal. Andhra Pradesh and Tamil Nadu Amritsar Kolkata Industrial Corridor (AKIC) AKIC will be structured around the Eastern Dedicated Freight Corridor (EDFC) as the backbone. The AKIC to develop densely populated northern and eastern states, and will also leverage the Inland Water System being developed along National Waterway-1. The government has approved the preparatory work on AKIC. The DMICDC is to undertake a feasibility study as the nodal agency. DMICDC has appointed M/s LEA Associates South Asia & M/s E&Y as Consultants for preparation of Perspective Plan for AKIC Project. The consultants have already submitted the Inception Report Punjab, Haryana, Uttar Pradesh, Uttarakhand, Bihar, Jharkhand and West Bengal. North East Connectivity During the last visit of the Indian Prime Minister to Japan, it was decided to connect the North East to other corridors and extend this connectivity to Myanmar on the other side. A review meeting under the chairmanship of Secretary, DIPP was held on 1st December 2015 on the proposal for connectivity and socioeconomic development of North- Eastern Region. Feasibility study has been initiated by JICA Eight of the North Eastern (NE) states Package for Special Category States The Central Government has formulated and notified the North East Industrial and Investment Promotion Policy (NEIIPP), 2007, to promote industrialization in the remote, hilly and inaccessible areas of NE region. NEIIPP, 2007, include Capital Investment Subsidy, Interest Subsidy, Reimbursement of Insurance, 100% Income Tax Exemption and Excise Duty Exemption based on value addition norms specified by the Department of Revenue, Ministry of Finance. NE States, Himachal Pradesh, Uttarakhand, Jammu & Kashmir, West Bengal, Andaman & Nicobar and Lakshadweep Source: Compiled by Uzabase from DIPP 2015-16 Annual Report
- 13. 13 Three Pillars to Sustainable Growth and Development in India I. Empowering the Population Through Streamlined Industrialisation and Modernisation Make in India Make in India and Overarching Industrial and Infrastructure Development Policy Framework The ‘Make in India’ scheme tweaks and streamlines the National Manufacturing Policy (NMP), with promises to periodically deregulate and de-license industries that have been regulated by the government. The “Make in India” initiative is essentially a global promotional campaign to project India as an investment destination and potential manufacturing hub. Prime Minister Modi launched the campaign on 25th September 2014, tasking the DIPP as the nodal agency that launches and executes the initiative. The initiative’s information portal, an easy to navigate website created on the lines of the state of Gujarat’s successful Investor Facilitation Portal, provides potential investors a quick peep into the 25 sectors where India wants to push labor-intensive manufacturing. The sectors under focus include auto manufacturing, physical infrastructure and a few service sectors. The online platform provides detailed sector information and regulatory information as well as monitoring the success of proposals and assisting with obtaining clearances, thus creating a single window mechanism for investors. The window takes the form of a campaign called ‘Invest India’, which is a collaborative venture between the Federation of Indian Chambers of Commerce and Industry (FICCI), the Department of Industrial Promotion and Policy (DIPP) and state governments and is intended to facilitate foreign investment by clarifying guidelines and suggesting Indian partners for joint ventures. The campaign’s website—tellingly, fronted by a lion made of machine parts—identifies the 25 sectors with potential for more indigenous manufacturing, and also hosts a Q&A interface where questions are answered by a panel of experts within 72 hours. The campaign looks to capitalise on India’s existing manufacturing success in some sectors (such as automobiles, pharmaceuticals and medical equipment) and to replicate these experiences to attract other new industries. These include labor-intensive industries, capital goods industries, and industries with significant strategic components such as IT hardware, defense equipment and renewable energy. With a policy to make in India and export anywhere, the country's industrial sector will be connected to the global economy by integrating it with the production network. In this regard, FDI norms in 15 major sectors have been relaxed, and 100% FDI is being allowed in most. These sectors are highlighted under the FDI section in this report. Some of these sectors, while open to 100% FDI, sometimes require government approvals while other sectors have an automatic investment route. ‘Make in India’ is also an attempt to develop and showcase how India can become more relevant to global production networks in the manner that the Indian software industry has already achieved.
- 14. 14 Three Pillars to Sustainable Growth and Development in India I. Empowering the Population Through Streamlined Industrialisation and Modernisation Ramping up Infrastructure Spending and Modernising Various Sectors Doubling Investments in Infrastructure Networks, both Modern and Traditional The Make in India initiative also seeks to increase investment in many of the infrastructure sectors including Roads and Highways, Ports and Shipping, Aviation, Thermal Power, Railways and Renewable Energy. The initiative, apart from targeting traditional infrastructure sectors also pursues to transform and boost investment in mega-infrastructures (such as industrial corridors), urban infrastructures (Smart Cities) and Renewable Energy and Railways in particular. Historically, investments have been largely concentrated in the power, telecom and road sectors. With India 2020, a Dun&Bradstreet report, suggesting that investment in infrastructure is expected to be the major growth driver for the Indian economy in the next few years, investment in the sector (as measured by gross fixed capital formation) is expected to surge to 10.2% of GDP by 2020 from around 6.8% of GDP in FY10. Infrastructure has largely been financed through budgetary allocations and internal resources raised through public sector ‘non-bank’ financial companies (NBFCs). Given the persistent gap in supply of funding, the government has promoted the public-private partnership (PPP) model. In the last couple of years, it has introduced reforms including single window clearances. With these developments, the private sector has emerged as a large investor, estimated to eventually contribute around 50% of total infrastructure investment. Between 2008 and 2014, bank credit to infrastructure as a percentage of total bank lending increased from 25.6% to 34.7%. Doubling of Infrastructure Investments Every Five Years India’s Five-year Plans Time Period Proposed Investments in Infrastructure (USD Billion) Private Sector Investments (Share as %) Tenth Five-year Plan 2002 - 2007 240 22% Eleventh Five-year Plan 2007 - 2012 500 37% Twelfth Five-year Plan 2012 - 2017 1,025 49% Fiscal prudence to ensure macroeconomic stability and long-term growth is expected to further limit the central government’s ability to allocate budgetary resources to large-scale infrastructure projects. As a result, enhanced participation from private sector and capital market depth for bond financing has been deemed necessary. Banks are overburdened in meeting the financing requirements of the sector particularly as their lending is restricted by exposure norms, capital adequacy requirements and an acute asset-liability mismatch. This asset liability mismatch has been mainly due to low long-term savings and insufficient financial market depth. Deposits in the Indian banking system are typically of a short tenure (between one and two years), whereas infrastructure loans have durations of 10 to 15 years.
- 15. 15 Three Pillars to Sustainable Growth and Development in India I. Empowering the Population Through Streamlined Industrialisation and Modernisation In September 2014, SEBI, the capital markets regulator, allowed firms to launch real estate investment trusts (REITs) and infrastructure investment trusts (InvITs) that allow project promoters to raise capital against projects from sources other than the banking sector and financial institutions such as non- banking financial companies (NBFCs). SEBI proposed a minimum sponsor/developer commitment of 10%. While mega-infrastructure development such as economic corridors and individual infrastructure sector investments have gained focus, of late, attention has been directed at the policies to develop urban infrastructure. With expanding urbanisation and fledgling urban centers, India has a dire need to organize and manage urban living spaces. In line with that, INR 980 billion was pledged in June 2015 for Smart City and Atal Mission for Rejuvenation and Urban Transportation (AMRUT) projects, while INR 480 billion has been earmarked for the Smart City project, INR 500 billion would be spent on AMRUT. Smart cities which focus on urban development for cities close to and above the population of 1 million, is just one of the three flagship urban missions launched by the Narendra Modi government to develop India’s urban centers, the other two being the infrastructure mission AMRUT and the Housing for All scheme. Details regarding Smart Cities are provided further ahead in the report. The AMRUT projects seek to: Ensure that every household has access to a tap with assured supply of water and a sewage connection. Increase the amenity value of cities by developing greenery and well maintained open spaces. Reduce pollution by switching to public transport or constructing facilities for non-motorized transport. The Mission is being implemented in 500 cities and towns with a population of over 100,000 inhabitants. The government had decided in 2015 to construct 29.5 million houses in rural areas under its ambitious Housing for All by 2022 scheme, the programme is aimed at the rehabilitation of slum-dwellers and promotion of affordable housing for the urban poor, targeting the provision of nearly 20 million houses over seven years.
- 16. 16 Three Pillars to Sustainable Growth and Development in India I. Empowering the Population Through Streamlined Industrialisation and Modernisation Renewable Energy and Railways are Non-traditional Infrastructure Sectors that are Luring FDI With the announcement of FDI inflows into large renewable energy projects in India in 2015, the country stands committed to producing 40% of its power from renewable resources by 2030, which was at 28% at the end of 2015. In 2015, India committed to increasing its renewable energy capacity to 175 gigawatts (GW) by 2022, more than twice the capacity of 77 GW capacity recorded in March 2015. About 100 GW of this would come from solar, with wind (60 GW), biomass (10 GW), and small hydropower (5 GW) accounting for the remainder India’s rising energy demand to feed its rapidly growing economy has made it the fourth largest importer of oil in the world. A more aggressive renewable policy will reduce the country’s dependence on fossil fuels and cut its import bill. Apart from boosting renewable energy resources, India’s renewable energy policy seeks to use renewables for the electrification of remote villages where it is difficult and uneconomical to connect with the national electricity grid. This creates a large demand to provide last-mile connectivity in electrification by promoting projects based on solar energy, biomass gasifiers and small hydro power plants. At the United Nations climate change meeting in Paris in December 2015, known as COP21, Prime Minister Modi also unveiled a global solar alliance, a grouping that would connect more than 100 tropical countries, which will share know-how on solar technology and policy formulation. With that came an agreement with the World Bank in June 2016 for an India-led International Solar Alliance (ISA) to boost solar energy in developing countries by mobilising USD 1 trillion in investments by 2030. With this the World Bank also plans to provide USD 1 billion in support of India’s initiative to expand solar power generation. The loan to India is the lender’s largest solar project funding for any country in the world. The targets that India has set for itself have been very ambitious and to reach its renewable energy goals by 2030, India would need investments to the tune of USD 60 billion per year. Until now India has only financed USD 10 billion, on average, on renewable power projects each year, but the government intends to double these investments in solar and wind energy projects to USD 20 billion annually for 2018 and 2019.
- 17. 17 Three Pillars to Sustainable Growth and Development in India I. Empowering the Population Through Streamlined Industrialisation and Modernisation All these efforts are intended to attract international companies that are looking to bring their renewable energy expertise to the Indian energy market thereby increasing investments in the country. The industry expanded robustly with installed renewable capacity growing 25%, reaching 39.5 GW in January 2016, from 31.7 GW in March 2014. Installed solar power capacity doubled to 5.2 GW from 2.6 GW over the same period. Total installed wind capacity stood at 22,465 MW in December 2014. The country intends to invest USD15 billion to almost triple this capacity to 60,000 MW over an 8 year period (ending 2022). The rail sector in India has traditionally been a state-owned monopoly and is the government’s largest commercial establishment, with limited private participation. The regulation change to allow 100% FDI and private investment in the railway infrastructure (excluding operations) has opened up opportunities for investments in suburban corridor projects, high-speed rail and tracks, dedicated freight corridors to mines and ports, and mass rapid transport system (MRTS). FDI of 100% in railways was introduced for the first time in 2014. Public-private partnership investments are also being introduced into the sector, which will allow for many special purpose vehicle (SPV) companies and joint ventures. The main reason to liberalise the railway sector was to boost the development and modernisation of this capital-intensive sector, to attract international capital and expertise. With large investments directed towards the roads and highway sector, investments in rail infrastructure have lagged over the last two decades. As of mid-2016 the Indian Railways was also close to financial bankruptcy with losses of INR 340 billion in operating passenger services and carry an additional burden of INR 4,835 billion towards the execution of 458 unfinished and ongoing projects. The government expects that the aging rail network needs at least USD 93 billion over the next five years to upgrade existing tracks, strengthen bridges and modernise signaling and communications. The long-term strategic plan of the Ministry of Railways is to construct six high-capacity, high-speed dedicated freight corridors along the Golden Quadrilateral of the National Highways and its diagonals. The 2014–15 Union Budget envisaged an extended Diamond Quadrilateral network of high-speed rail, connecting the four major metros and growth centres of the country.
- 18. 18 Three Pillars to Sustainable Growth and Development in India I. Empowering the Population Through Streamlined Industrialisation and Modernisation Proposed Diamond Quadrilateral High-Speed Rail to Connect the Four Large Metros Source: nextbigfuture.com The First 20 of 100, Smart Cities Initiative to Modernize India’s Urban Landscape It comes as no surprise that the Smart Cities project has caught the attention of the media and investors as it was titled “100 Smart Cities Initiative” to drive growth. The project seeks to modernize India’s urban landscape to make them more livable by leveraging on the power of IT and foreign investments. Countries such as Singapore, Japan, France, Germany and the United States, and companies from 14 countries including US, Canada, United Kingdom, France, the Netherlands, Spain, Italy, Belgium, Norway, Japan, Singapore, Hong Kong, South Africa and Abu Dhabi have been selected for preparation of city level Smart City Plans for 42 of the Mission cities. The list of 100 cities was announced last year and the states of Uttar Pradesh and Tamil Nadu had the most number allotted to them and the choice of cities was carried out by the respective states’ governments themselves. In January 2016, 20 from the pool of 100 cities were selected by the Central government to be developed under the 1st phase of the Smart Cities Mission. The budget allocation is an estimated INR 10 billion to each selected city over a span of five years (Central government funding of INR 5 billion, matched with equal funding from States/local bodies).
- 19. 19 Three Pillars to Sustainable Growth and Development in India I. Empowering the Population Through Streamlined Industrialisation and Modernisation First 20 smart cities under 'Smart Cities Mission' (January 2016) Rank City State Population 1 Bhubaneswar Odisha 840,834 2 Pune Maharashtra 3,124,000 3 Jaipur Rajasthan 3,073,350 4. Surat Gujarat 4,467,797 5 Kochi Kerala 601,574 6 Ahmedabad Gujarat 5,577,940 7 Jabalpur Madhya Pradesh 1,216,445 8 Visakhapatnam Andhra Pradesh 1,878,980 9 Solapur Maharashtra 952,000 10 Davanagere Karnataka 435,128 11 Indore Madhya Pradesh 2,195,274 12 New Delhi Municipal Council Delhi 249,998 13 Coimbatore Tamil Nadu 1,601,438 14 Kakinada Andhra Pradesh 350,968 15 Belagavi Karnataka 488,292 16 Udaipur Rajasthan 475,150 17 Guwahati Assam 9,62,334 18 Chennai Tamil Nadu 6,727,000 19 Ludhiana Punjab 1,618,874 20 Bhopal Madhya Pradesh 1,922,130 Source: Compiled by Uzabase from http://pib.nic.in/ and www.thehindu.com The Minister for Urban Development, Venkaiah Naidu, while announcing the cities in the first phase of the mission stated that it was high time investments were being made based on competitive selection of cities. The Ministry has expressed the gravity of the project by implementing fines on States that violate the timeline of 60 days for finalizing projects. It is no coincidence that Parag Khanna mentions in his book that industrial parks or “smart cities” have become the new supply chain nodes. These are the fastest-growing category of cities in the world with populations of around one million, usually built around one major company or industry. Khanna’s observation is that these factory-towns that are connected to global supply chains will eventually spread economic growth beyond the benefits of aid programs. With commodities’ prices remaining low, it is expected that the Narendra Modi government can keep inflation in check and continue its major commitments to roads and railways, ports and airports and modernising dozens of cities across the nation. 10 of the 20 cities have proposed to mobilise INR 85.21 billion under PPP model while the rest have also indicated this option. A total area of 26,735 acres have been identified by these cities for making them “smart” through necessary interventions.
- 20. 20 Three Pillars to Sustainable Growth and Development in India I. Empowering the Population Through Streamlined Industrialisation and Modernisation There have been criticisms against the plans for the Smart Cities mission, including the Central government proposal to incentivising development of only a small area of the cities and not the entire city mainly with the intention of land monetization. There have also been issues with the governance framework proposed, as the project will be delegated to Special Purpose Vehicles (SPVs), a body that will set up and which would implement the mission that might be bypassing city administrations.
- 21. 21 Three Pillars to Sustainable Growth and Development in India I. Empowering the Population Through Streamlined Industrialisation and Modernisation New Foreign Trade Policy to Prop “Make in India” New Policy is no Old Wine in New Bottle The new foreign trade policy has been tailored to ensure the successful implementation of the Make in India programme. The policy aims to help navigate the challenges imposed by the external environment while keeping pace with the evolving international trade circuit. The highlight of the policy is the introduction of two new schemes: - Merchandise Exports from India Scheme (MEIS) - Services Exports from India Scheme (SEIS) Both schemes aim to improve the exports of specified goods and services respectively. With the help of these schemes, the Government hopes to more than double India’s exports to USD 900 billion by 2020 from USD 310.3 billion currently. Five existing schemes to promote merchandise exports have been brought under a single Merchandise Exports from India Scheme (MEIS). The Served from India Scheme (SFIS) has been replaced by the Service Exports from India Scheme (SEIS) For the FTP to work in tandem with Make in India, the government has reduced export obligation for capital goods purchased from Indian suppliers under the EPCG (Export Promotion of Capital Goods) scheme. Essentially the exporters that export products that has a higher level of domestic content get more rewards making it easier and cheaper to export. India’s Foreign Trade Policy (FTP) covers policies related to fiscal incentives, rationalised procedures, institutional changes, increased access to global markets and diversification of its export market. The FTP places special emphasis on key sectors, including agriculture, handicrafts, leather, gems and jewelry, marine products, handlooms, chemicals, electronics, IT hardware, pharmaceuticals, automobiles, machineries, sports goods and toys, to generate manufacturing capabilities and employment opportunities and ultimately, increase India’s share in global trade (which was 2.07% in 2013 for goods and services). The cumulative value of India’s exports for merchandise goods has been hovering above USD 300 billion since 2012 but slipped to USD 287.6 billion in 2015. Trade (exports and imports) as a percentage of GDP stood at 45% in 2006, rose to 55% of GDP in 2011 and is now hovering at around 50% of GDP.
- 22. 22 Three Pillars to Sustainable Growth and Development in India I. Empowering the Population Through Streamlined Industrialisation and Modernisation Source: http://commerce.nic.in/MOC/index.asp Website of Ministry of Commerce & Industry, compiled by Uzabase For export value to double by 2020, exports need to grow at about 24% per annum. The new economic- growth model is being shifted to an export-oriented manufacturing from a domestic economy dominated by the service sector. Service sector exports of India accounted for USD 155.6 billion in 2014 (almost 50% of total exports), making it the eighth largest services exporter globally. This growth in exports is still dependent on global recovery, which does not seem very positive in the near future. However, the government fully aware that exports cannot be made competitive just by throwing sops for exporters has implemented policies to use duty free scrips freely transferable as per global norms. Duty free scrips are paper authorizations that allow the holder to import inputs that go into manufacture of products that are exported or machinery used for producing such goods without paying duties equivalent to the printed value. For instance, if a duty free scrip is valued at INR 100,000, the holder can use it to import such goods without paying duties up to INR 100,000. This would be used by exporters to pay indirect taxes and duties and they would also be applicable in SEZs. Further, to give a boost to “Make in India” the Export Promotion Capital Goods (EPCG) scheme in the new trade policy allows import of capital goods for pre-production, production and post-production at zero customs duty. It also allows procurement of capital goods from domestic sources. Under this, the export obligation will be equivalent to six times the duty saved on capital goods. All of these are efforts towards making exports more competitive, but there have been criticisms that the government still needs to reduce import duties further.
- 23. 23 Three Pillars to Sustainable Growth and Development in India I. Empowering the Population Through Streamlined Industrialisation and Modernisation Spurring Mine Activity to Restrict Imports India’s status as a net importer of coal is beginning to diminish. It hopes to become self-sufficient by 2017 and perhaps a net exporter thereafter. Coal India has begun opening one new mine a month to meet the target of doubling coal production by 2020. Source: UNComtrade The total quantity of coal imported by India had been rising steadily until 2015 when it dropped 4.75% YoY. Though figures are unavailable, the quantity of imports is estimated to have dropped a further 23% YoY in January 2016. Coupled with lower commodity prices, Indonesia now faces the threat of having India as an exporter of coal in Asia. Though we have used only coal as an example here, the trend is now evident with other metals and minerals as well. Aside from the convoluted bureaucracy that an investor has to overcome, India does indeed have a number of growth drivers in the Mining Sector. Coal and Iron are expected to receive a major boost with the economy growing at more than 7%. India is one of the largest low cost producers of metals and minerals in the world. India has 301.56 billion tonnes of coal reserves and production of coal stood at about 600 million tonnes in 2015-16. FDI up to 100% allowed, in exploration, mining and processing, under the automatic route. FDI in coal mining allowed for captive consumption.
- 24. 24 Three Pillars to Sustainable Growth and Development in India I. Empowering the Population Through Streamlined Industrialisation and Modernisation Oil Prices Pose Dilemma in Ensuring Lower Current Account Deficit India’s rapid growth has catapulted it as the World’s third largest oil importer behind the US and China. By 2035, India is expected to import 92% of its oil requirement, up from 73% in 2010, according to the International Energy Agency. Fortunately for the country, crude prices are low now and are expected to stay so. At present the country is the largest customer of the OPEC cartel, accounting for 86% of India’s imports. This poses another dilemma in the form of remittances. The large Indian diaspora accounts for more than half the $72 billion remittance the country received in 2015, making India the largest remittance receiving country in the world. Until now these remittances have funded the goods trade deficit with GCC, leaving a surplus of $22 billion. But if the oil prices continue to be low, the economic activity in GCC will come down sharply to cause fiscal stress on not just the trade deficit but also on people’s livelihood. These remittances account for more than 4% of GDP. Source: tradingeconomics.com The Foreign Direct Investment Policy Seeks to Keep India as the World’s Most Attractive Investment Destination The Department of Industrial Policy & Promotion (DIPP) has become the nodal Department for formulation of the policy of the Government on FDI. It is also responsible for maintenance and management of data on inward FDI into India, based upon the remittances reported by the Reserve Bank of India. The FDI is being constantly reviewed to making it investor-friendly in order to attract higher levels of FDI. The government has put in place a liberal policy on FDI, under which FDI, up to 100%, is permitted, under the automatic route, in many sectors and activities that are being constantly being reviewed and updated as well. Invest India has become the umbrella under which the governments seeks to assist and handhold foreign investors, Invest India has been set up as a Joint Venture Company (Not for Profit Company) between Department of Industrial Policy & Promotion (DIPP), Ministry of Commerce and Industry, Government of India, Federation of Indian Chambers of Commerce and Industry (FICCI) and various State Governments. Invest India is responsible for promoting and facilitating investments to India. The shareholding is 51% of FICCI, 45% of DIPP and 4% with the states.
- 25. 25 Three Pillars to Sustainable Growth and Development in India I. Empowering the Population Through Streamlined Industrialisation and Modernisation An Investor Facilitation Cell has been created at Invest India to assist, guide, support, handhold and facilitate investors during various stages of their project. All these developments came in the backdrop of India topping the FDI destinations for 2015. India replaced China as the leading destination for FDI projects in the Asia-Pacific region with USD 63 billion of announced inward capital investment across the year, thus expanding the country's trade and foreign currency reserves. Source: fDI Intelligence But what matters even more in the long term is cumulative FDI inflows and when compared to China’s USD100 billion of FDI inflows annually over the past decade, India’s average inflow of USD 20 billion compares quite poorly. Though the news has been motivating in the midst of global economic downtrend, for FDI to really impact India like the way it did China there has to be large consistent flows. Only then can it contribute to technology, exports, competitiveness and higher levels of economic growth. India’s reserves have increased to USD 361 billion as of May 2016, the ninth largest in the world. Source: Centre for Monitoring Indian Economy (CMIE), accessed 15 May 2015
- 26. 26 Three Pillars to Sustainable Growth and Development in India I. Empowering the Population Through Streamlined Industrialisation and Modernisation It is also interesting to note that the top investment sector in the country last year was renewable energy. India is emerging as a key destination for renewable energy projects, with wider government policy of incentives, infrastructure and programmes designed to attract investment especially in this sector. The country topped the rankings in 2015 with USD 11.8 billion of announced FDI in the sector, which included Lightsource Renewable Energy’s plans to invest $3bn to design, install and manage 3+ gigawatts of solar power. A couple of high-profile projects were announced during the year. SunEdison, the Missouri-based power company, said in January 2015 that it will invest $4 billion to build a solar panel factory in India—the biggest in the country. Foxconn, the Taiwanese manufacturer which makes iPhones, has also said it will invest $5 billion over the next five years in a manufacturing unit in the western Indian state of Maharashtra. Source: fDi Intelligence It is also no surprise that according to the data from fDi Intelligence, the state of Gujarat, Modi’s home state, received the highest FDI in the country, in fact it received the most FDI between all the provinces in China and India put together for 2015. Major impetus put on industrial development, job creation and infrastructure investments, radical changes in FDI policy regime are beginning to take place with a lot of sectors now open for FDI under the automatic route as opposed to the government approvals. Now 100% FDI is allowed in many sectors including – Civil aviation and building up of airports, construction development and built-up infrastructure, telecom services, wholesale trading and e-commerce activities, railway infrastructure, pharmaceuticals, and others.
- 27. 27 Three Pillars to Sustainable Growth and Development in India I. Empowering the Population Through Streamlined Industrialisation and Modernisation FDI ceilings under Automatic Route in Infrastructure Sector Sectors Per cent Telecom 100% Electricity generation, transmission and distribution (except nuclear power) 100% Roads and Highways 100% Ports and Harbours 100% Civil Aviation (in Greenfield airport ventures) 100% Railway Infrastructure 100% Industrial Parks 100% Construction Development, including Built-up Infrastructure 100% Source: Compiled by Uzabase from DIPP Manual 2015 FDI Ceilings Under Automatic Route in Service Sector Sectors Per cent Courier services 100% Trading - Cash & Carry Wholesale Trading/Wholesale Trading 100% E-commerce activities 100% Non-Banking Finance Companies (NBFC) – including Portfolio Management Services, Investment Advisory Services, Financial Consultancy, Stock Broking, Asset Management, Venture Capital, etc. 100% Pharmaceuticals (Greenfield Projects only) 100% Source: Compiled by Uzabase from DIPP Manual 2015
- 28. 28 Three Pillars to Sustainable Growth and Development in India I. Empowering the Population Through Streamlined Industrialisation and Modernisation Appendix Movement of Fundamental Indicators during Modi’s Term Source: Mospi, RBI Source: RBI Source: RBI
- 29. 29 Three Pillars to Sustainable Growth and Development in India I. Empowering the Population Through Streamlined Industrialisation and Modernisation Source: eaindustry.nic.in Source: RBI Source: RBI
- 30. 30 Three Pillars to Sustainable Growth and Development in India I. Empowering the Population Through Streamlined Industrialisation and Modernisation Tokyo Uzabase, Inc. Ebisu First Square. 10F 1-18-14 Ebisu, Shibuya-ku, Tokyo 150-0013, Japan +81-3-4574-6552 +81-3-4574-6553 customer@uzabase.com Singapore 20 Collyer Quay, #23-01, Singapore 049319 +65-6653-8314 customer@uzabase.com Hong Kong 30/F Entertainment Building, 30 Queen's Road Central, Central, Hong Kong +852-5808-3148 +852-3103-1011 customer@uzabase.com Sri Lanka 48/4/1, Parkway building, Park Street, Colombo 2. Sri Lanka. +94-114-232-622 customer@uzabase.com Shanghai 606, No.1440 Yan’An Rd.(M), Shanghai, China +86-21-6103-1677 customer@uzabase.com ©2016 UZABASE, Inc. About US