Competing Indentation Deformation Mechanisms in Glass Using Different Strengthening Methods
 Jian Luo*
 Peter J. Lezzi
 K. Deenamma Vargheese
 Adama Tandia
Jason T. Harris
Timothy M. Gross
Adama Tandia
Jason T. Harris
Timothy M. Gross  John C. Mauro*
- Science and Technology Division, Corning Incorporated, Corning, NY, USA
Chemical strengthening via ion exchange, thermal tempering, and lamination are proven techniques for the strengthening of oxide glasses. For each of these techniques, the strengthening mechanism is conventionally ascribed to the linear superposition of the compressive stress (CS) profile on the glass surface. However, in this work, we use molecular dynamics simulations to reveal the underlying indentation deformation mechanism beyond the simple linear superposition of compressive and indentation stresses. In particular, the plastic zone can be dramatically different from the commonly assumed hemispherical shape, which leads to a completely different stress field and resulting crack system. We show that the indentation-induced fracture is controlled by two competing mechanisms: the CS itself and a potential reduction in free volume that can increase the driving force for crack formation. Chemical strengthening via ion exchange tends to escalate the competition between these two effects, while thermal tempering tends to reduce it. Lamination of glasses with differential thermal expansion falls in between. The crack system also depends on the indenter geometry and the loading stage, i.e., loading versus after unloading. It is observed that combining thermal tempering or high free volume content with ion exchange or lamination can impart a relatively high CS and reduce the driving force for crack formation. Therefore, such a combined approach might offer the best overall crack resistance for oxide glasses.
Introduction
Intrinsic damage resistance by composition design and extrinsic surface strengthening methods, such as ion exchange (Cooper and Krohn, 1969; Mackenzie and Wakaki, 1980; Price et al., 2009; Varshneya, 2010) and thermal tempering (Gardon, 1980), are the key for improving the performance of oxide glasses against contact cracking. Such strengthening methods are ubiquitous in commercial applications, including cover glasses for electronic devices, high pressure windows, security and safety glasses, etc. Emerging demand for stronger and lighter car windshields and other novel transparent structural materials further stimulates a need for deeper understanding and improvement of glass strengthening techniques. Studies of contact cracking (Lawn and Wilshaw, 1975; Ostojic and McPherson, 1987; Cook and Pharr, 1990) date back at least one century (Johnson, 1985; Lawn, 1998) and tremendous progress has been achieved to understand the shear flow, densification, and cracking under indentation in brittle solids (Lawn and Swain, 1975; Lawn and Wilshaw, 1975; Marshall and Lawn, 1978; Hagan, 1979; Lawn et al., 1983; Johnson, 1985; Ostojic and McPherson, 1987; Cook and Pharr, 1990; Lawn, 1998, 2004; Perriot et al., 2006; Gross and Tomozawa, 2008a,b,c; Gross et al., 2009; Kato et al., 2010; Gross, 2012a; Kassir-Bodon et al., 2012; Niu et al., 2012; Tran et al., 2012; Kjeldsen et al., 2013; Smedskjaer et al., 2013; Striepe et al., 2013b; Aakermann et al., 2015; Rouxel and Yokoyama, 2015). It is commonly believed that the surface strengthening against contact cracking comes from the linear superposition of a compressive stress (CS) profile onto the surface of the glass (Marshall and Lawn, 1978; Lawn and Fuller, 1984). This raises the question of whether there is any difference among various surface strengthening methods beyond the magnitude and profile of the CS (Zijlstra and Burggraaf, 1968, 1969). For a given glass composition, the crack resistance of a thermally tempered sample can sometimes be better than its chemically strengthened counterpart, despite the much higher values of CS in the latter (Koike et al., 2012). Such a counter-intuitive observation hints at the existence of additional non-linear effects induced by the various strengthening techniques. For example, the ion exchange process introduces a composition gradient in the glass that is known to change the local intrinsic properties such as elastic constant, hardness, and flow mechanism (Mackenzie and Wakaki, 1980; Calahoo et al., 2016; Svenson et al., 2016). Importantly, it has been observed that the equilibrium density of ion-exchanged glass fibers is larger than that of glasses with equivalent compositions (Mackenzie and Wakaki, 1980). It has been established that densification during indentation is crucial for crack resistance (Kato et al., 2010) and affects the yielding and constitutive law (Mantisi et al., 2016). Therefore, the densification caused by ion exchange might limit the ability of the glass to densify during indentation, an effect that may act to compromise crack resistance. In isostatically compressed glasses, crack resistance is indeed observed to be lower (Striepe et al., 2013a,b; Aakermann et al., 2015). This raises the question of whether there are any differences in the effect of densification caused by mechanical compression versus ion exchange.
In this study, we use molecular dynamics simulations (MD) to investigate the change in deformation mechanism in glass that results from the use of different strengthening methods. Our study reveals dramatically different stress fields that cannot be explained by a simple superposition of a CS profile. Hence, different crack resistance during loading or after unloading can be caused by different strengthening methods even for the same CS profile. The stress field difference is found to be controlled by the change in plastic zone shape and densification pattern underneath the indenter. The underlying deformation mechanism change is controlled by two competing mechanisms, i.e., the gain from CS and the potential increase in driving force for crack formation during loading or after unloading largely due to free volume reduction. Based on the simulation results, strategies to improve crack resistance are discussed.
Materials and Methods
In this study, for the silicate glass from the sodium end-member in the series of standard Na–K aluminosilicate glasses (Kjeldsen et al., 2014) with the mole % composition of (Na2O)15(MgO)5(Al2O3)11(SiO2)69, we generate two samples with very different free volume content. The high free volume (HFV) content glass is intended to mimic a glass with native damage resistance or a tempered normal oxide glass with very high fictive temperature (Gross et al., 2009). The low free volume (LFV) content glass can be viewed as a model for pressure quenched glass (Yuan and Huang, 2014) or hot compressed sample (Striepe et al., 2013b; Aakermann et al., 2015). The free volume content is controlled via a constant volume quenching process in an NVT ensemble (constant number of atoms, constant volume, and constant temperature) (Nosé, 1984) by specifying the initial density of the melts to be 2.34 and 3 g/cm3. The difference in the initial densities is chosen to be large to amplify the possible effect of free volume. The quenching process starts with a slab sample made of approximately 20,000 atoms with random coordinates equilibrated at 4000 K for 1 ns. Then, the high temperature melt is quenched to 300 K continuously over a period of 8 ns. Finally, the glass is relaxed at 300 K under atmospheric pressure for 1 ns. The as-quenched density of two samples is 2.47 and 2.91 g/cm3, respectively. Periodic boundary conditions are applied in all directions.
As shown in Figure 1, we use mechanical compression to obtain the CS introduced by thermal tempering or differential CTE lamination, and we use direct atom swapping to mimic ion exchange (Tandia et al., 2012a; Vargheese et al., 2014). Uniaxial compression in x direction (see the coordinates in Figure 2) is applied to achieve a CS from −1 to −2.7 GPa. Stress in z direction is kept at 0. Plane strain conditions are applied in xz plane so that the thickness in y direction is kept as a constant. Ion exchange can be mimicked by directly replacing all Na+ ions with K+ ions (Vargheese et al., 2014). Then, a relaxation time of 0.4 ns allows for the stress in the z direction to be relaxed to 0, and the dimensions in the x and y directions are kept as constant. During the relaxation, the stress in x direction (see the coordinates in Figure 2) first decreases and then stabilizes at −1.5 GPa for the HFV content sample and at −2.7 GPa for the LFV content sample. The ion exchange process can be viewed as a through-thickness, full ion exchange with the sample confined in a frame with infinite stiffness. Therefore, no force balance from central tension is modeled, so the CS from ion exchange will be higher than what is achieved in experiment. Furthermore, no gradient is modeled in both the mechanical and chemical cases with the assumption that a CS profile with gradient can be modeled by different thin layers with uniform CS (Lawn and Fuller, 1984). Note that the ion-exchanged sample is denser than its compositionally equivalent as-melted counterpart under the same stress state, in agreement with previous experiment (Mackenzie and Wakaki, 1980) and simulations (Tandia et al., 2012a; Vargheese et al., 2014). In short, ion exchange densifies the sample beyond the mechanical stress. It is also interesting to note that the sample with HFV acquires lower CS after ion exchange. In other words, increasing free volume (for example by tempering in normal oxide glasses) decreases the network dilation coefficient, also known as the Cooper coefficient (Cooper and Krohn, 1969; Svenson et al., 2014).
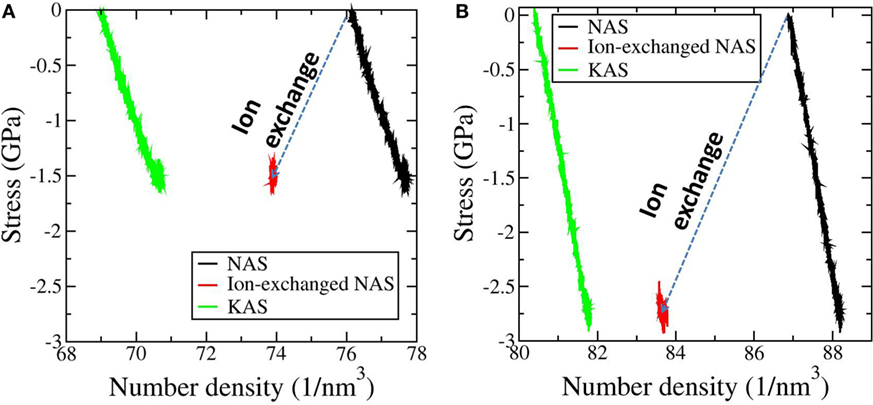
Figure 1. Stress-number density plot during mechanical compression (black curves) and ion exchange (red curves) for the sodium aluminosilicate glass (NAS) with high free volume in (A) and the sample with low free volume in (B). The mechanical compression curve for the as-quenched potassium-aluminosilicate glass (KAS) with the same composition as the ion-exchanged NAS is also shown for comparison (green curves). Note that the ion exchanged sample has a higher number density than its compositionally equivalent as-quenched counterpart at the same compressive stress. In short, ion exchange densifies the sample beyond the mechanical stress. The sample with low free volume has higher compressive stress after ion exchange. In other words, decreasing free volume increases the Cooper coefficient.
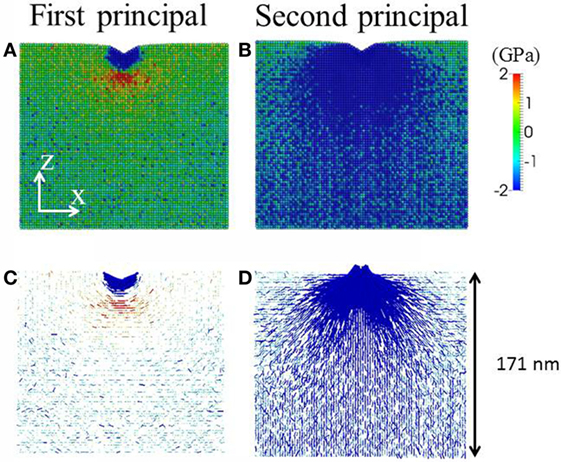
Figure 2. Example representations of in-plane stress field under indentation with penetration depth of 10 nm and indenter angle of 120°. First principal stress field is shown in (A,C) and second principal stress field in (B,D). In (A,B), the magnitude of the local stress field averaged over 2 nm × 3 nm × 2 nm voxels is denoted by the color bar. Tensile stress is positive and compressive stress is negative. In (C,D), in addition to the color, the direction of the stress is denoted by the line. The length of the line is proportional to the magnitude of the stress. The sample size is chosen so that the indentation stress field is away from the boundary of the simulation box. In the rest of the paper, close-up views of first principal stress field with overlapping color and line representations will be used.
The indentation simulation details follow our previous study on crack nucleation (Luo et al., 2016c). Here, we use a wedge indenter with the speed of 5 m/s. The indenter speed equals that of an object dropping from 1 m height and is three orders of magnitude slower than the elastic wave speed. Following previous MD studies (Shi and Falk, 2007; Shi et al., 2014; Yuan and Huang, 2014; Luo and Shi, 2015b), we replicate the small slab sample in x and z directions to make the sample large enough for indentation testing. The indentation depth is 10 nm, and the sample size is up to 170 nm for the widest indenter angle 120° as shown in Figure 2. The periodicity in the replicated sample will be canceled by the inhomogeneous stress field under the indenter (Shi and Falk, 2007). We keep the surface atomically smooth so that we can avoid the complication from surface cracks. In this way, we can focus on the deformation mechanism, which is the theme of this study. We use carbon atoms to explicitly simulate the indenter (Luo et al., 2016c). The carbon atoms interact with the glass via the ZBL potential, which describes the screened nuclear repulsion between atoms (Ziegler and Biersack, 1985).
We use first principal stress field to predict the crack system during and after indentation. The local stress and densification field can be obtained by averaging the corresponding quantities in a voxel of 2 nm × 3 nm × 2 nm (Luo and Shi, 2015a). For example in Figure 2, we show the first principal and second principal stress field during loading under a 120° indenter. The first principal stress exhibits a tensile zone under the compressive zone below the indenter, and the tensile stress is predominately in the hoop direction. The second principal stress is almost entirely compressive and in the radial direction. Note that due to the small sample size and lack of defects, no direct crack formation is observed, which is quantitatively explained in our previous study on crack nucleation (Luo et al., 2016c). Provided the self-similarity in the stress field, cracking in larger defected samples can be evaluated (Lawn and Evans, 1977). In other words, we can use the stress field to infer the crack system. For example, in Figure 2, it is readily seen that median crack is the major crack system. In the following sections, we show the close-up views of first principal stress field under different indenter geometry during loading and after unloading for different samples. We use atomic shear strain to characterize the plastic zone shape under indentation (Falk and Langer, 1998; Falk, 1999; Shi and Falk, 2005; Luo et al., 2016a). The Green strain tensor is calculated for each atom from the deformation gradient tensor, which represents the affine deformation that best describes the transformation from the initial neighboring atomic configuration to the current neighboring atomic configuration (Falk and Langer, 1998). The shear strain is the Von Mises equivalent strain in the Green strain tensor (Shimizu et al., 2007; Bower, 2009). Following previous MD studies on the mechanical properties of oxide glasses (Tandia et al., 2012a,b; Vargheese et al., 2014; Luo et al., 2016c), the Pedone force field (Pedone et al., 2006) is employed. All the simulations were conducted using LAMMPS (Plimpton, 1995).
Results
Stress Field during Loading
Comparing the stress field in the base glass with no initial CS, it can be seen that the tensile stress buildup is less pronounced in the HFV sample in Figure 3A than in the LFV sample in Figure 3B. The stress field and the crack system also depend on the indenter geometry. For both non-strengthened glasses, increasing indenter angle reduces the magnitude of the tensile stress, which is in agreement with previous experiments and simulations (Gross, 2012a; Luo et al., 2016c). Moreover, for the high density glass, the major crack system changes from median and lateral cracks under 60° indenter, to lateral crack under 90° indenter and back to median crack under 120° indenter. A similar trend is also observed in both the low and high density glasses with initial CS of −1 GPa. Note that the location of the stress concentration for lateral crack is observed to be beside the compressive (plastic) zone, which is in agreement with the “shallow lateral crack” observed in experiment (Arora et al., 1979; Cook and Pharr, 1990; Gross and Tomozawa, 2008c), although lateral crack can also go through the bottom of the compressive zone (Lawn and Swain, 1975; Cook and Pharr, 1990). Increasing the CS beyond −1 GPa will completely suppress tensile stress during loading except for extremely sharp indenter with angle equal or smaller than 60°. For the practically achievable CS at −1 GPa, not much tensile stress is observed under 120° indenter for both the low density and the high density glasses. Therefore, it is expected that a crack can hardly form during loading under Vicker’s indentation in ion-exchanged (IOX) glasses with relatively high CS, which is supported by an experiment observation (Tandon and Cook, 1993).
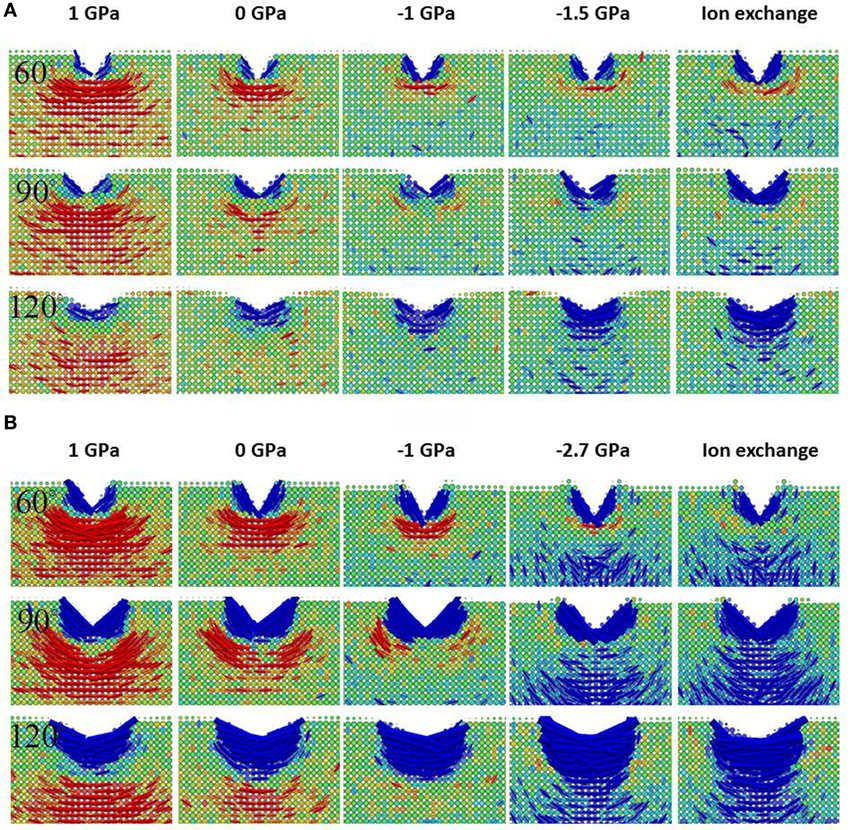
Figure 3. Close-up view of the first principal stress field during loading for the base glass with high free volume in (A) and low free volume in (B). The indentation depth is 10 nm. The apparent voxel size is rendered proportional to the number of atoms it contains in order to better depict the sinking-in and pileup on the surface of the sample. Sinking-in is more apparent in (A), and pile-up is more apparent in (B). Sinking-in increases with increasing indenter angle, while pileup decreases with increasing indenter angle. The color bar is the same as in Figure 2. From left to right, each column corresponds to a different initial σxx as labeled on the top. The last two columns have the same initial σxx, which is achieved via mechanical and ion exchange methods, respectively. From left to right, the free volume effectively decreases. From top to bottom, each row corresponds to the indenter angle of 60°, 90°, and 120°, respectively.
For the last two columns in Figures 3A,B, the stress field at peak loading is shown for the same CS level induced by mechanical compression and ion exchange. No major differences are observed for the glasses with different initial density, as hardly any tensile stress is caused by indentation with all three geometries except for the high density glass with mechanical compression under 60° indenter, where minor tensile stress shows up. The difference in residual stress is larger as discussed in the following sections.
Stress Field after Unloading
As shown in Figure 4, dramatic differences can be seen in the residual stress field after unloading between the two samples with different levels of free volume. For the sample with HFV, very little residual stress is observed for almost all the initial stress levels except the sample under initial tension. More indentation-induced densification leads to lower tensile stress, which is in agreement with experimental observations (Gross and Tomozawa, 2008a,b; Gross et al., 2009; Kato et al., 2010). For the sample with LFV content, large residual tensile stress shows up after unloading. As expected, increasing CS decreases the driving force for median crack formation. But it is interesting to note the increase of the driving force for lateral crack formation after increasing the CS in the LFV glass. Such trend is especially prominent when the indenter angle is 120°. The trend is in agreement with the experimental observation that ion exchange can promote lateral crack formation (Gross, 2012b). By comparing the HFV glass at −1 and −1.5 GPa initial CS, we can also see a tendency for the lateral crack driving force to increase with increasing CS. But, the tendency is much weaker in the HFV sample, indicating that the embrittlement brought about by ion exchange can be alleviated by increasing free volume, for example via thermal tempering for normal oxide glasses. Comparing to annealed glass, the glass made by fusion draw process might also possess an advantage due to the fast quenching rate. When we include the non-strengthened glass in the comparison, it is interesting to note that the residual stress seems to exhibit a minimum for the intermediate CS level at −1 GPa. Decreasing or increasing the CS from −1 GPa tends to increase the residual stress. Apparently, the direct reason cannot be a linear superposition of CS; rather, there are two competing mechanisms at work. In a later section, we will show that the change in the stress field is correlated with the densification and shear deformation change under indentation.
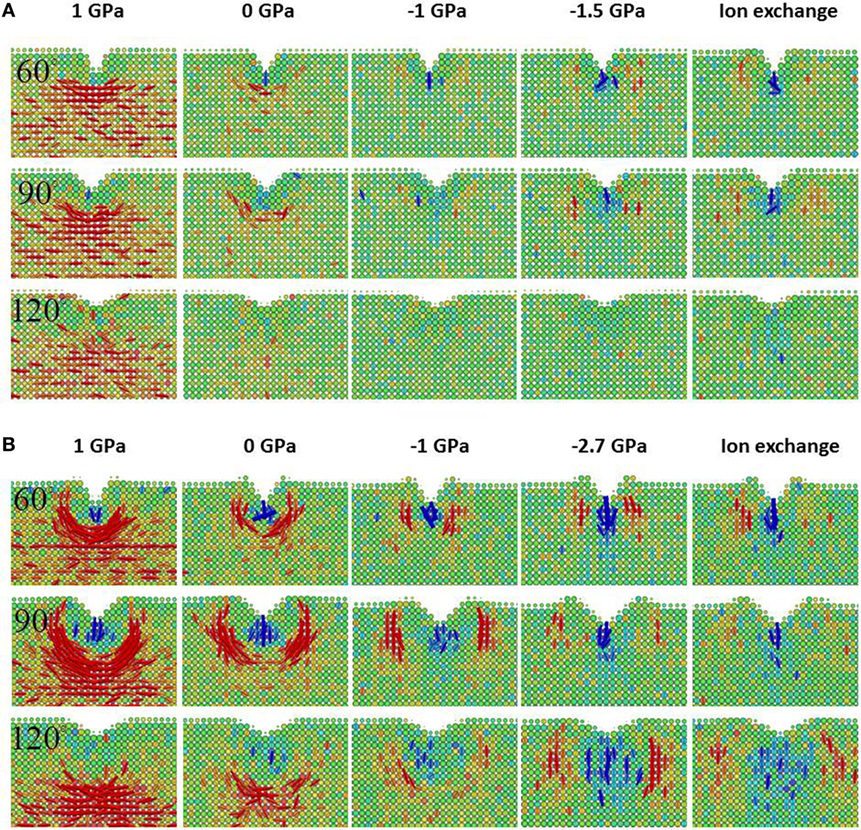
Figure 4. Close-up view of the first principal stress field after unloading for the base glass with high free volume in (A) and low free volume in (B). The apparent voxel size is rendered proportional to the number of atoms it contains in order to better depict the profile of the surface of the sample. The color bar is the same as in Figure 2. From left to right, each column corresponds to a different initial σxx as labeled on the top. The last two columns have the same initial σxx, which is achieved via mechanical and ion exchange methods, respectively. From left to right, the free volume effectively decreases. From top to bottom, each row corresponds to the indenter angle of 60°, 90°, and 120°, respectively.
The indenter geometry also has interesting effects on the residual stress field and resulting crack system. For the non-strengthened glass with HFV, increasing indenter angle reduces the magnitude of the residual tensile stress. In contrast, for the high density glass, the effect of indenter geometry is manifested in the change of the major crack system from lateral cracks under 60° and 90° indenters to median crack under 120° indenter. At higher CS, the effect of indenter geometry diminishes as the lateral cracking becomes the main crack system, as discussed above. The simulation result suggests that the effect of the indenter geometry depends on the thermal history and strengthening state of the glasses.
We examine the difference between mechanical compression and ion exchange by comparing the last two columns in Figures 4A,B. The residual stress field after loading is shown for the same CS level induced by mechanical compression or ion exchange. No major differences can be observed for the sample with HFV content. A noticeable difference shows up in the residual stress field for the LFV sample under 120° indenter. In the following sections, the difference is correlated with the change in the amount of densification and shear deformation.
The Deformation Mechanism Change
The comparison between the stress fields in samples with different CS levels can be made “unbiased” if the initial CS is removed. Therefore, we define the net stress field as the current stress field subtracted by the initial stress field. If the linear superposition of CS is the only effect induced by strengthening, then the net stress field will be the same for all the samples with different initial CS values. However, as shown in rows 1–3 in Figure 5, it is clearly not the case, especially for the glass with LFV. In rows 1–3 in Figure 5B, when the sample is subjected to increasing CS, it tends to have less driving force for median crack formation and more driving force for lateral cracking even after the effect of CS is removed. The trend is the same but much weaker in the sample with HFV content shown in Figure 5A, as not much residual stress is observed after unloading. Comparing the net stress field in samples with the same CS level induced by mechanical compression or ion exchange under 90° and 120° indenter, we see that ion exchange tends to shift the driving force of lateral cracking further away from the center.
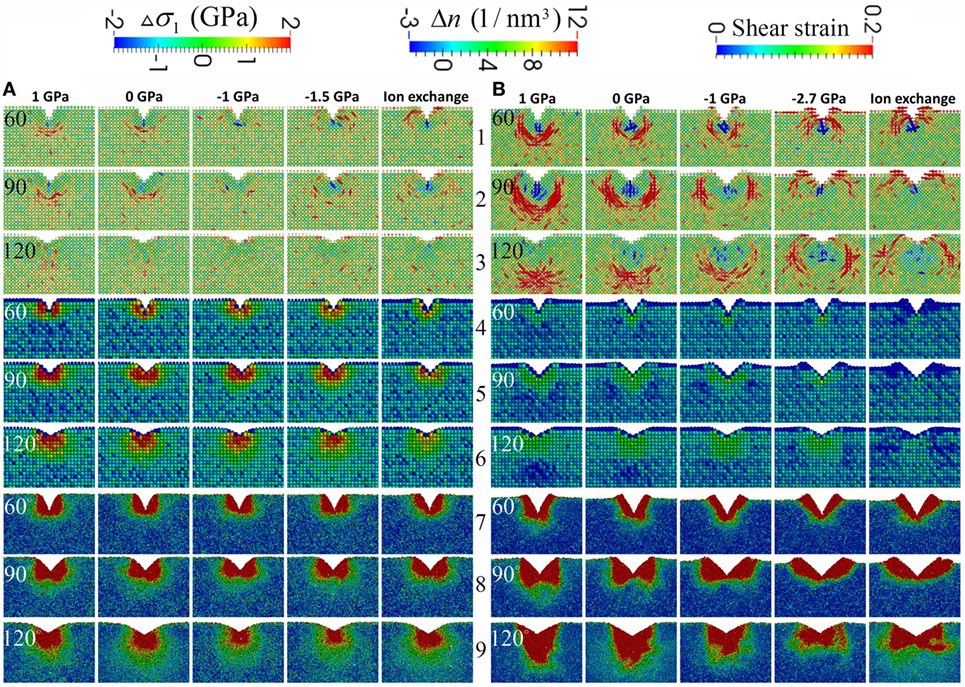
Figure 5. Close-up view of the net first principal stress field after unloading in rows 1–3, the local number density change in rows 4–6, and the local shear strain in rows 7–9 for the base glass with high free volume in (A) and low free volume in (B). The net stress field is defined as the current stress field subtracted by the initial stress field. The apparent voxel size is rendered proportional to the number of atoms it contains in order to better depict the profile of the surface of the sample. From left to right in (A,B), each column corresponds to a different initial σxx as labeled on the top. The last two columns in (A,B) have the same initial σxx, which is achieved via mechanical and ion exchange methods, respectively. From left to right, the free volume effectively decreases in (A,B). From top to bottom, every three rows correspond to the indenter angle of 60°, 90°, and 120°, respectively. The net residual stress field correlates strongly with the dilation zone in blue, especially for the sample with low free volume. The plastic zone shape indicated by the local shear strain changes dramatically for the sample with low free volume content, when CS is increased or the sample is ion exchanged. Note the correlation between the net residual stress field with the corners of the plastic zone in red, especially for the sample with low free volume content.
In rows 4–6 in Figure 5, the densification map is shown for the samples with varying levels of free volume and CS after indentation with different indenter angles. Comparing rows 4–6 in Figures 5A,B, it is apparent that the samples with HFV content exhibit much more pronounced densification after indentation across all conditions. For each sample, going from left to right when the CS level increases or effectively the free volume decreases, the densification after indentation decreases, which correlates with the increase in the driving force for a lateral crack. For each sample, going from rows 4 to 6 in Figure 5 when the indenter angle increases, the densification region tends to increase. In the maps of local number density change in Figure 5B, a noticeable “dilation” zone appears. Also, its location changes from underneath the densification zone to beside the densification zone when increasing the CS level or indenter sharpness. By comparing the dilation zone with the net residual stress in Figure 5B, we can see that the tensile zone in the net stress field is well correlated with the dilation zone in the number density change map. Comparing the last two columns in Figures 5A,B, we see less densification in an IOX sample than in the mechanically compressed sample under the same CS level, which is in agreement with Figure 1 because the ion exchange consumes the free volume.
The change in densification map and stress field is further correlated with the plastic zone in Figure 5. In rows 7–9 in Figure 5A, the plastic zone is shown for the sample with HFV content sample under different CS levels and indenters with different sharpness. The plastic zone shape is similar to the conventionally assumed hemispherical in almost all the conditions except for the 90° indenter, where a butterfly shape develops. When the CS level increases, the size of the plastic zone exhibits a minimum at intermediate CS level of −1 GPa, which is correlated with the minimum in the residual stress. In Figure 5B, the plastic zone for the sample with LFV content can be considerably different from the conventionally assumed hemisphere. Going from left to right when the CS level increases or effectively the free volume decreases, the depth of the plastic zone becomes more and more limited. For example, when the indenter angle is 120° and the CS is 0, the plastic zone develops deeper into the sample and forms a sharp corner facing downwards along the center line; in the IOX sample under 120° indenter, the plastic zone develops laterally and forms a butterfly shape. A butterfly-shaped plastic zone can also be seen in the non-strengthened sample under 90° indenter. But when the CS increases, the shear deformation moves toward the upper surface and pronounced pileup can be seen, especially in rows 8 and 9 in Figure 5B. In short, strengthened glass, especially IOX glass, will limit the shear deformation toward the surface. Comparing the last two columns in Figure 5B, noticeable difference can be observed between mechanical compression and ion exchange when the indenter is 120°. The shear deformation is directed away from the center of the indent in the IOX sample, which correlates with the observation that the driving force for lateral crack in the IOX sample is also to the side of the center of the indent. By comparing the plastic zone with the residual stress, it is interesting to note that the tensile zone develops at the boundary and especially pronounced at the sharp corner of the plastic zone, suggesting that the plastic zone shape dictates the stress field and crack formation.
The Quantitative Stress Distribution under Indentation
In this section, we show the quantitative stress distribution under indentation for four representative samples: the two as-quenched samples with LFV and HFV content and the corresponding two IOX samples. To put the stress field into perspective, the fracture and yield loci for these four samples are also calculated and shown in Figure 6. Following our previous studies (Luo et al., 2016b,c), an independent set of simulations under homogeneous loading is employed to obtain the fracture and yield locus. To mimic the stress state in a thick sample and to be consistent with the indentation simulation, we consider the plane strain condition, and hence only two degrees of freedom exist, i.e., σ1 and σ2, which represent the first and second principal stresses in the plane, respectively. In tension and compression tests, the ratio of σ2/σ1 is tuned from −1 to 1 in steps of 0.2. In the other half of the space from σ1/σ2 = −1 to 1, the yield/fracture locus can be obtained by symmetry since the glasses are isotropic. In Figures 6A–D, the stress strain curves under tension or compression with different ratios of σ2/σ1 are shown for the four samples. In all the four samples under tension, a brittle to ductile transition occurs when the ratio of σ2/σ1 decreases from 1 to −1. Under compression, all samples exhibit hardening behavior near equal-biaxial CS states with σ2/σ1 ≥ 0.8, which is as expected. The HFV sample exhibits ideal plasticity with σ2/σ1 < 0.8, while slight overshoot and then shear softening appears in the HFV sample after ion exchange for −1 ≤ σ2/σ1 ≤ −0.2. Pronounced overshoot and shear softening behavior appear in the LFV sample with or without ion exchange. The peak stress states during these simulations can be used to form the yield/fracture locus to depict the boundary of accessible stress states of a given sample as shown in Figure 6E in the in-plane principal stress domain and in Figure 6F in the domain of in-plane hydrostatic stress and maximum shear stress. The LFV sample has a larger fracture locus than that of the HFV sample, which is due to a larger Young’s modulus since from Figure 6G we see that the LFV sample has lower fracture strain values. After ion exchange, however, the fracture locus of the IOX LFV sample becomes smaller than that of the IOX HFV sample. From Figure 6H, the effect of shear on fracture is manifested by the observation that a shear strain of around 0.1 gives the smallest hydrostatic fracture strain, which might be analogous to the shear facilitated fracture in metallic glasses (Luo and Shi, 2015b; Yang et al., 2016).
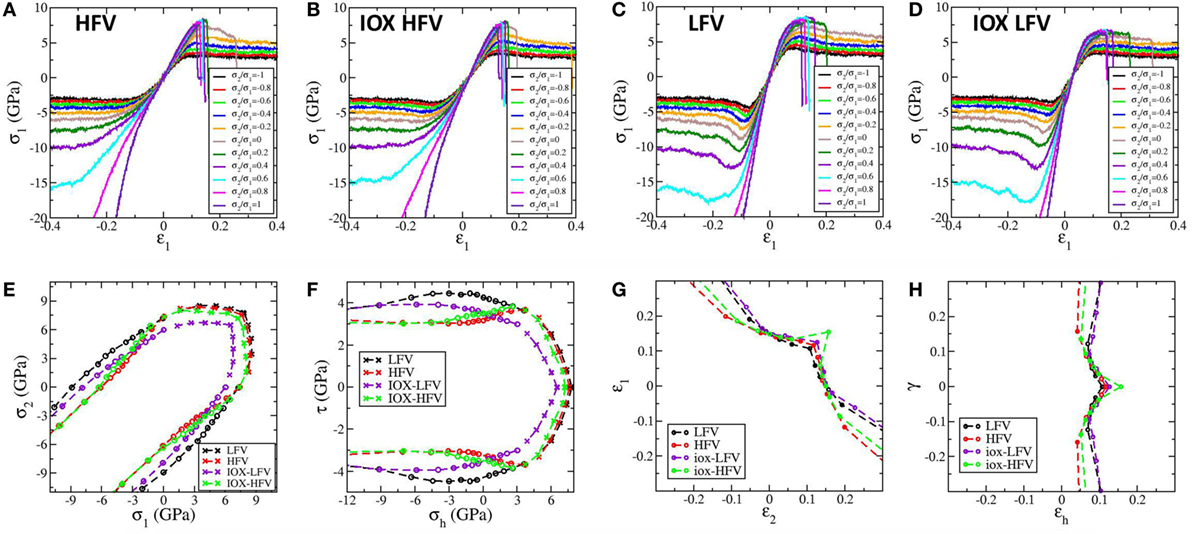
Figure 6. Stress–strain curves under labeled stress ratios of σ2/σ1 for high free volume (HFV) sample, high free volume after ion exchange (IOX HFV), low free volume (LFV) sample, and low free volume sample after ion exchange (IOX LFV) in (A–D), respectively. (E) The fracture and yield locus the in-plane principal stress domain. Fracture is denoted by crosses and yielding is denoted by circles. (F) The fracture and yield locus in the domain of in-plane hydrostatic stress and maximum shear stress. (G) The in-plane principal strains at fracture. (H) The hydrostatic strain and shear strain at fracture. Note the existence of minimal values in hydrostatic strains at a shear strain of around 0.1 for all the four samples.
In Figure 7, for the four representative samples, we show the scatter plot of all the local stress states under indentation during loading and after unloading with labeled indenter angle in the in-plane principal stress domain along with the corresponding fracture/yield locus. The meaning of the directions in the principal stress domain is illustrated in the first plot in Figure 7. Under 60° indenter during loading, the stress states range from shear to uniaxial compression and to a biaxial compressive state with σ1/σ2 around 0.5. The largest CS in the HFV and IOX HFV samples is slightly less than 9 GPa and that in the LFV and IOX LFV samples is slightly larger than 9 GPa. Increasing the indenter angle generates more CS states. For the LFV sample and LFV IOX samples, the peak CS approaches 15 GPa. Almost all the local stress states are bounded by the yield locus as expected. The outliers are probably due to the expected fluctuation in the local voxels with the dimensions of 2 nm × 3 nm × 2 nm. Upon unloading, the CS decreases and most of the material returns to stress free conditions in the HFV sample and the IOX HFV sample. However, in the LFV sample and LFV IOX sample, more residual stress develops in the direction of uniaxial tension or even biaxial tension direction. Under 60° indenter, the maximum tensile stress during loading is larger than that after unloading for all four samples, suggesting that the crack is more likely to form during loading under 60° indenter. The difference between the maximum tensile stress during loading and after unloading becomes very small when the indenter angle is 90°. Under 120° indenter, the maximum tensile stress during loading is smaller than that after unloading for all four samples, suggesting that crack is more likely to form during unloading under indenter with 120° or larger angle.
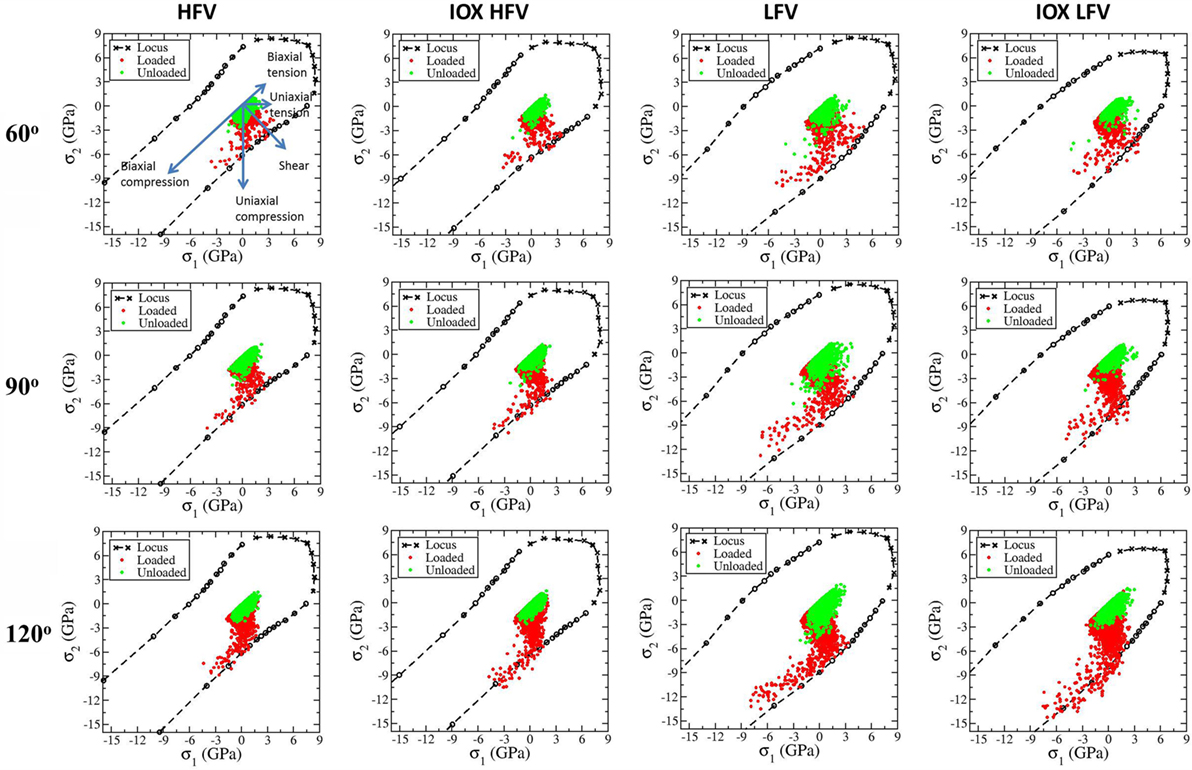
Figure 7. Scatter plot of all the local stress states under indentation during loading and after unloading with labeled indenter angle in the in-plane principal stress domain along with the corresponding fracture/yield locus. The meaning of the directions in the principal stress domain is illustrated in the first plot. From left to right, each column corresponds to HFV, IOX HFV, LFV, IOX LFV samples. From top to bottom, each row corresponding to 60°, 90°, 120° indenters.
Discussion
The crack resistance is controlled by the interplay between stress field, densification, and the shear deformation. Decreasing free volume will promote shear deformation, which will develop pileup or corners in the plastic zone and in turn will dictate the increase in residual stress after unloading. Increasing CS further regulates and limits the shear flow toward the surface (leading to pileup) and therefore changes the shape of the plastic zone. The change in plastic zone, in turn, changes the residual stress and leads to a transition from median cracking to a lateral crack system. Shear deformation can also be promoted by increasing the sharpness of the indenter. In this process, we see the strengthening methods actually increase the residual stress for lateral cracking. However, we also have shown that by increasing the free volume of the base glass the competition can be alleviated as shown in Figures 4A and 5A, until the CS is too high and the beneficial effect diminishes. This might explain the minimum residual stress field observed in the sample with HFV and intermediate CS level. For normal oxide glasses, free volume can be increased by fast quenching via fusion draw process or during the thermal tempering process. Free volume can also be increased by composition design, for example, to have 4-coordinated Al and 3-coordinated B as implemented in native damage resistant (NDR) Gorilla® Glass (Mauro et al., 2016).
As shown in Figure 1 and previous experiments (Mackenzie and Wakaki, 1980) and simulations (Tandia et al., 2012a; Vargheese et al., 2014), ion stuffing itself also decreases the free volume and is analogous to a partial annealing process. Therefore, the ion exchange process will densify the glass more than mechanical compression and hence escalate this deleterious effect. In contrast, a benefit of thermal tempering can be attributed to the increase of free volume content resulting from high fictive temperature. The CS imparted by thermal tempering is typically small compared to that obtained from ion exchange. Higher CS can be achieved by combining ion exchange with thermal tempering without invoking the adverse effects that lead to lateral crack formation, as shown in Figure 4A. In addition, the time for ion exchange is often reduced due to the more open structure that results in easier diffusion (Svenson et al., 2016). Therefore, the combination of thermal tempering and ion exchange or differential CTE laminating might offer the best overall crack resistance. The combination of a NDR glass with HFV with an appropriate level of CS is also a promising approach.
Glass composition also strongly influences the indentation fracture resistance, even though this study focuses on only one base glass composition. Therefore, the effect of composition is worthy of future study. One underlying assumption is a positive dependence of free volume on fictive temperature, which is applicable to normal oxide glasses with relatively high content of modifiers (Gross and Tomozawa, 2008b). Also, we want to emphasize that free volume, used here as a measure of densifiability, is defined relative to the state after compression or deformation that a given composition can achieve. The state after compression or deformation is found to be linked to the high fictive temperature state or rejuvenated state for oxide glasses, amorphous silicon, and metallic glasses (Demkowicz and Argon, 2004; Gross and Tomozawa, 2008c; Luo et al., 2014), which might involve dramatic structural change, such as coordination number change. Caution should be used when trying to access free volume difference by comparing the density, number density, or packing fraction across different compositions since the reference state can depend on composition. Moreover, oxide glasses can show different intrinsic toughening mechanisms via shear rather than by densification (Rosales-Sosa et al., 2016), which is worth more attention. According to previous studies (Rouxel, 2007; Shi et al., 2014), the ability to shear is associated with the opposite glass properties, such as LFV, high packing density, and high Poisson’s ratio. Therefore, the trends observed here might have to be reevaluated to understand deformation mechanisms in those glasses. We also did not distinguish the difference between free volume reduction achieved by pressure or annealing. The exact thermal history might have additional effects on medium-range structure (Guerette et al., 2015) and crack resistance (Smedskjaer et al., 2015), which also warrants further study.
Conclusion
In MD simulations, rich indentation behaviors induced by tuning the indenter angle, free volume content, CS magnitude, and strengthening methods have been observed and are largely in agreement with experimental results. The underlying mechanism is proven herein to be much more than the conventionally assumed linear superposition of CS. Indentation response is controlled by the strong correlation between densification, shear deformation, and stress field or crack system under the indentation. We reveal a hidden mechanism that competes against the strengthening effect. CS can dramatically change the shape of the plastic zone and limits the shear deformation toward the surface, which causes residual stress that produces lateral cracks. Free volume content is observed to mitigate such competition and thus can help improve the crack resistance in strengthened glasses. This may explain why Corning’s NDR glasses can achieve non-linear increase in crack resistance by ion exchange and other strengthening mechanisms. It also indicates an advantage of the high fictive temperature, which is a result of Corning’s fusion draw process. In a normal oxide glass, combining tempering with the other two strengthening methods can achieve relatively high CS and less residual stress after indentation, which may offer the optimized crack resistance.
Author Contributions
All authors listed have made substantial, direct, and intellectual contribution to the work and approved it for publication.
Conflict of Interest Statement
The authors declare that the research was conducted in the absence of any commercial or financial relationships that could be construed as a potential conflict of interest.
Acknowledgments
The authors are grateful for the support from the computational support from Scientific Computation team at Corning and CCI at Rensselaer Polytechnic Institute.
References
Aakermann, K. G., Januchta, K., Pedersen, J. A. L., Svenson, M. N., Rzoska, S. J., Bockowski, M., et al. (2015). Indentation deformation mechanism of isostatically compressed mixed alkali aluminosilicate glasses. J. Non Cryst. Solids 426, 175–183. doi:10.1016/j.jnoncrysol.2015.06.028
Arora, A., Marshall, D. B., Lawn, B. R., and Swain, M. V. (1979). Indentation deformation/fracture of normal and anomalous glasses. J. Non Cryst. Solids 31, 415–428. doi:10.1016/0022-3093(79)90154-6
Calahoo, C., Zhang, X., and Zwanziger, J. W. (2016). Nanoindentation study of the surface of ion-exchanged lithium silicate glass. J. Phys. Chem. C 120, 5585–5598. doi:10.1021/acs.jpcc.6b00733
Cook, R. F., and Pharr, G. M. (1990). Direct observation and analysis of indentation cracking in glasses and ceramics. J. Am. Ceram. Soc. 73, 787–817. doi:10.1111/j.1151-2916.1990.tb05119.x
Cooper, A. R., and Krohn, D. A. (1969). Strengthening of class fibers: 11, ion exchange. J. Am. Ceram. Soc. 52, 665–669. doi:10.1111/j.1151-2916.1969.tb16073.x
Demkowicz, M., and Argon, A. (2004). High-density liquidlike component facilitates plastic flow in a model amorphous silicon system. Phys. Rev. Lett. 93, 025505. doi:10.1103/PhysRevLett.93.025505
Falk, M. (1999). Molecular-dynamics study of ductile and brittle fracture in model noncrystalline solids. Phys. Rev. B 60, 7062–7070. doi:10.1103/PhysRevB.60.7062
Falk, M. L., and Langer, J. S. (1998). Dynamics of viscoplastic deformation in amorphous solids. Phys. Rev. E 57, 7192. doi:10.1103/PhysRevE.57.7192
Gardon, R. (1980). “Chapter 5 – thermal tempering of glass,” in Glass Science and Technology, eds D. R. Uhlmann and N. J. Kreidl (New York: Elsevier), 145–216.
Gross, T. M. (2012a). Deformation and cracking behavior of glasses indented with diamond tips of various sharpness. J. Non Cryst. Solids 358, 3445–3452. doi:10.1016/j.jnoncrysol.2012.01.052
Gross, T. M. (2012b). “Scratch damage in ion-exchanged alkali aluminosilicate glass: crack evolution and the dependence of lateral cracking threshold on contact geometry,” in Fractography of Glasses and Ceramics VI (Hoboken: John Wiley & Sons, Inc), 113–122.
Gross, T. M., and Tomozawa, M. (2008a). Crack-free high load Vickers indentation of silica glass. J. Non Cryst. Solids 354, 5567–5569. doi:10.1016/j.jnoncrysol.2008.09.015
Gross, T. M., and Tomozawa, M. (2008b). Fictive temperature-independent density and minimum indentation size effect in calcium aluminosilicate glass. J. Appl. Phys. 104, 063529. doi:10.1063/1.2985907
Gross, T. M., and Tomozawa, M. (2008c). Indentation-induced microhardness changes in glasses: possible fictive temperature increase caused by plastic deformation. J. Non Cryst. Solids 354, 4056–4062. doi:10.1016/j.jnoncrysol.2008.05.042
Gross, T. M., Tomozawa, M., and Koike, A. (2009). A glass with high crack initiation load: role of fictive temperature-independent mechanical properties. J. Non Cryst. Solids 355, 563–568. doi:10.1016/j.jnoncrysol.2009.01.022
Guerette, M., Ackerson, M. R., Thomas, J., Yuan, F., Bruce Watson, E., Walker, D., et al. (2015). Structure and properties of silica glass densified in cold compression and hot compression. Sci. Rep. 5, 15343. doi:10.1038/srep15343
Hagan, J. T. (1979). Micromechanics of crack nucleation during indentations. J. Sci. Mater. 14, 2975–2980. doi:10.1007/BF00611482
Kassir-Bodon, A., Deschamps, T., Martinet, C., Champagnon, B., Teisseire, J., and Kermouche, G. (2012). Raman mapping of the indentation-induced densification of a soda-lime-silicate glass. Int. J. Appl. Glass Sci. 3, 29–35. doi:10.1111/j.2041-1294.2012.00078.x
Kato, Y., Yamazaki, H., Yoshida, S., and Matsuoka, J. (2010). Effect of densification on crack initiation under Vickers indentation test. J. Non Cryst. Solids 356, 1768–1773. doi:10.1016/j.jnoncrysol.2010.07.015
Kjeldsen, J., Smedskjaer, M. M., Mauro, J. C., Youngman, R. E., Huang, L., and Yue, Y. (2013). Mixed alkaline earth effect in sodium aluminosilicate glasses. J. Non Cryst. Solids 369, 61–68. doi:10.1016/j.jnoncrysol.2013.03.015
Kjeldsen, J., Smedskjaer, M. M., Mauro, J. C., and Yue, Y. (2014). On the origin of the mixed alkali effect on indentation in silicate glasses. J. Non Cryst. Solids 406, 22–26. doi:10.1016/j.jnoncrysol.2014.09.036
Koike, A., Akiba, S., Sakagami, T., Hayashi, K., and Ito, S. (2012). Difference of cracking behavior due to Vickers indentation between physically and chemically tempered glasses. J. Non Cryst. Solids 358, 3438–3444. doi:10.1016/j.jnoncrysol.2012.02.020
Lawn, B., and Wilshaw, R. (1975). Indentation fracture: principles and applications. J. Sci. Mater. 10, 1049–1081. doi:10.1007/BF00823224
Lawn, B. R. (1998). Indentation of ceramics with spheres: a century after hertz. J. Am. Ceram. Soc. 81, 1977–1994. doi:10.1111/j.1151-2916.1998.tb02580.x
Lawn, B. R. (2004). Fracture and deformation in brittle solids: a perspective on the issue of scale. J. Mater. Res. 19, 22–29. doi:10.1557/jmr.2004.19.1.22
Lawn, B. R., Dabbs, T. P., and Fairbanks, C. (1983). Kinetics of shear-activated indentation crack initiation in soda-lime glass. J. Sci. Mater. 18, 2785–2797. doi:10.1007/BF00547596
Lawn, B. R., and Evans, A. G. (1977). A model for crack initiation in elastic/plastic indentation fields. J. Sci. Mater. 12, 2195–2199. doi:10.1007/BF00552240
Lawn, B. R., and Fuller, E. R. (1984). Measurement of thin-layer surface stresses by indentation fracture. J. Sci. Mater. 19, 4061–4067. doi:10.1007/bf00980772
Lawn, B. R., and Swain, M. V. (1975). Microfracture beneath point indentations in brittle solids. J. Sci. Mater. 10, 113–122. doi:10.1007/bf00541038
Luo, J., Keblinski, P., and Shi, Y. (2016a). A model metallic glass exhibits size-independent tensile ductility. Acta Mater. 103, 587–594. doi:10.1016/j.actamat.2015.10.029
Luo, J., Vargheese, K. D., Tandia, A., Harris, J. T., and Mauro, J. C. (2016b). Structural origin of intrinsic ductility in binary aluminosilicate glasses. J. Non Cryst. Solids 452, 297–306. doi:10.1016/j.jnoncrysol.2016.09.010
Luo, J., Vargheese, K. D., Tandia, A., Hu, G., and Mauro, J. C. (2016c). Crack nucleation criterion and its application to impact indentation in glasses. Sci. Rep. 6, 23720. doi:10.1038/srep23720
Luo, J., and Shi, Y. (2015a). The local stress state of a running shear band in amorphous solids. J. Mater. Res. 30, 1979–1987. doi:10.1557/jmr.2015.141
Luo, J., and Shi, Y. (2015b). Tensile fracture of metallic glasses via shear band cavitation. Acta Mater. 82, 483–490. doi:10.1016/j.actamat.2014.09.008
Luo, J., Shi, Y., and Picu, C. R. (2014). Shear-induced volumetric strain in CuZr metallic glass. Int. J. Eng. Sci. 83, 99–106. doi:10.1016/j.ijengsci.2014.04.009
Mackenzie, J. D., and Wakaki, J. (1980). Effects of ion exchange on the Young’s modulus of glass. J. Non Cryst. Solids 38, 385–390. doi:10.1016/0022-3093(80)90449-4
Mantisi, B., Kermouche, G., Barthel, E., and Tanguy, A. (2016). Impact of pressure on plastic yield in amorphous solids with open structure. Phys. Rev. E 93, 033001. doi:10.1103/PhysRevE.93.033001
Marshall, D. B., and Lawn, B. R. (1978). Strength degradation of thermally tempered glass plates. J. Am. Ceram. Soc. 61, 21–27. doi:10.1111/j.1151-2916.1978.tb09221.x
Mauro, J. C., Tandia, A., Vargheese, K. D., Mauro, Y. Z., and Smedskjaer, M. M. (2016). Accelerating the design of functional glasses through modeling. Chem. Mat. 28, 4267–4277. doi:10.1021/acs.chemmater.6b01054
Niu, Y.-F., Han, K., and Guin, J.-P. (2012). Locally enhanced dissolution rate as a probe for nanocontact-induced densification in oxide glasses. Langmuir 28, 10733–10740. doi:10.1021/la300972j
Nosé, S. (1984). A unified formulation of the constant temperature molecular dynamics methods. J. Chem. Phys. 81, 511. doi:10.1063/1.447334
Ostojic, P., and McPherson, R. (1987). A review of indentation fracture theory: its development, principles and limitations. Int. J. Fract. 33, 297–312. doi:10.1007/BF00044418
Pedone, A., Malavasi, G., Menziani, M. C., Cormack, A. N., and Segre, U. (2006). A new self-consistent empirical interatomic potential model for oxides, silicates, and silica-based glasses. J. Phys. Chem. B 110, 11780–11795. doi:10.1021/jp0611018
Perriot, A., Vandembroucq, D., Barthel, E., Martinez, V., Grosvalet, L., Martinet, C., et al. (2006). Raman microspectroscopic characterization of amorphous silica plastic behavior. J. Am. Ceram. Soc. 89, 596–601. doi:10.1111/j.1551-2916.2005.00747.x
Plimpton, S. (1995). Fast parallel algorithms for short-range molecular dynamics. J. Comput. Phys. 117, 1–19. doi:10.1006/jcph.1995.1039
Price, J. J., Glaesemann, G. S., Clark, D. A., Gross, T. M., and Barefoot, K. L. (2009). 69.3: a mechanics framework for ion-exchanged cover glass with a deep compression layer. SID Symp. Digest Tech. Pap. 40, 1049–1051. doi:10.1889/1.3256467
Rosales-Sosa, G. A., Masuno, A., Higo, Y., and Inoue, H. (2016). Crack-resistant Al2O3-SiO2 glasses. Sci. Rep. 6, 23620. doi:10.1038/srep23620
Rouxel, T. (2007). Elastic properties and short-to medium-range order in glasses. J. Am. Ceram. Soc. 90, 3019–3039. doi:10.1111/j.1551-2916.2007.01945.x
Rouxel, T., and Yokoyama, Y. (2015). Elastic properties and atomic bonding character in metallic glasses. J. Appl. Phys. 118, 044901. doi:10.1063/1.4926882
Shi, Y., and Falk, M. L. (2005). Structural transformation and localization during simulated nanoindentation of a noncrystalline metal film. Appl. Phys. Lett. 86, 011914. doi:10.1063/1.1844593
Shi, Y., and Falk, M. L. (2007). Stress-induced structural transformation and shear banding during simulated nanoindentation of a metallic glass. Acta Mater. 55, 4317–4324. doi:10.1016/j.actamat.2007.03.029
Shi, Y., Luo, J., Yuan, F., and Huang, L. (2014). Intrinsic ductility of glassy solids. J. Appl. Phys. 115, 043528. doi:10.1063/1.4862959
Shimizu, F., Ogata, S., and Li, J. (2007). Theory of shear banding in metallic glasses and molecular dynamics calculations. Mat. Trans. 48, 2923–2927. doi:10.2320/matertrans.MJ200769
Smedskjaer, M. M., Bauchy, M., Mauro, J. C., Rzoska, S. J., and Bockowski, M. (2015). Unique effects of thermal and pressure histories on glass hardness: structural and topological origin. J. Chem. Phys. 143, 164505. doi:10.1063/1.4934540
Smedskjaer, M. M., Mauro, J. C., Kjeldsen, J., and Yue, Y. (2013). Microscopic origins of compositional trends in aluminosilicate glass properties. J. Am. Ceram. Soc. 96, 1436–1443. doi:10.1111/jace.12298
Striepe, S., Potuzak, M., Smedskjaer, M. M., and Deubener, J. (2013a). Relaxation kinetics of the mechanical properties of an aluminosilicate glass. J. Non Cryst. Solids 362, 40–46. doi:10.1016/j.jnoncrysol.2012.11.017
Striepe, S., Smedskjaer, M. M., Deubener, J., Bauer, U., Behrens, H., Potuzak, M., et al. (2013b). Elastic and micromechanical properties of isostatically compressed soda–lime–borate glasses. J. Non Cryst. Solids 364, 44–52. doi:10.1016/j.jnoncrysol.2013.01.009
Svenson, M. N., Thirion, L. M., Youngman, R. E., Mauro, J. C., Bauchy, M., Rzoska, S. J., et al. (2016). Effects of thermal and pressure histories on the chemical strengthening of sodium aluminosilicate glass. Front. Mater. 3:14. doi:10.3389/fmats.2016.00014
Svenson, M. N., Thirion, L. M., Youngman, R. E., Mauro, J. C., Rzoska, S. J., Bockowski, M., et al. (2014). Pressure-induced changes in interdiffusivity and compressive stress in chemically strengthened glass. ACS Appl. Mater. Interfaces 6, 10436–10444. doi:10.1021/am5019868
Tandia, A., Vargheese, K. D., and Mauro, J. C. (2012a). Elasticity of ion stuffing in chemically strengthened glass. J. Non Cryst. Solids 358, 1569–1574. doi:10.1016/j.jnoncrysol.2012.04.021
Tandia, A., Vargheese, K. D., Mauro, J. C., and Varshneya, A. K. (2012b). Atomistic understanding of the network dilation anomaly in ion-exchanged glass. J. Non Cryst. Solids 358, 316–320. doi:10.1016/j.jnoncrysol.2011.09.034
Tandon, R., and Cook, R. E. (1993). Indentation crack initiation and propagation in tempered glass. J. Am. Ceram. Soc. 76, 885–889. doi:10.1111/j.1151-2916.1993.tb05311.x
Tran, H., Clément, S., Vialla, R., Vandembroucq, D., and Rufflé, B. (2012). Micro-Brillouin spectroscopy mapping of the residual density field induced by Vickers indentation in a soda-lime silicate glass. Appl. Phys. Lett. 100, 231901. doi:10.1063/1.4725488
Vargheese, K. D., Tandia, A., and Mauro, J. C. (2014). Molecular dynamics simulations of ion-exchanged glass. J. Non Cryst. Solids 403, 107–112. doi:10.1016/j.jnoncrysol.2014.07.025
Varshneya, A. K. (2010). The physics of chemical strengthening of glass: room for a new view. J. Non Cryst. Solids 356, 2289–2294. doi:10.1016/j.jnoncrysol.2010.05.010
Yang, Y., Luo, J., Huang, L., Hu, G., Vargheese, K. D., Shi, Y., et al. (2016). Crack initiation in metallic glasses under nanoindentation. Acta Mater. 115, 413–422. doi:10.1016/j.actamat.2016.06.001
Yuan, F., and Huang, L. (2014). Brittle to ductile transition in densified silica glass. Sci. Rep. 4, 5035. doi:10.1038/srep05035
Ziegler, J., and Biersack, J. (1985). “The stopping and range of ions in matter,” in Treatise on Heavy-Ion Science, ed. D. A. Bromley (New York: Springer US), 93–129.
Zijlstra, A. L., and Burggraaf, A. J. (1968). Fracture phenomena and strength properties of chemically and physically strengthened glass. J. Non Cryst. Solids 1, 49–68. doi:10.1016/0022-3093(68)90006-9
Zijlstra, A. L., and Burggraaf, A. J. (1969). Fracture phenomena and strength properties of chemically and physically strengthened glass II. Strength and fracture behaviour of chemically strengthened glass in connection with the stress profile. J. Non Cryst. Solids 1, 163–185. doi:10.1016/0022-3093(69)90015-5
Keywords: oxide glass, surface strengthening, indentation, densification, MD simulation
Citation: Luo J, Lezzi PJ, Vargheese KD, Tandia A, Harris JT, Gross TM and Mauro JC (2016) Competing Indentation Deformation Mechanisms in Glass Using Different Strengthening Methods. Front. Mater. 3:52. doi: 10.3389/fmats.2016.00052
Received: 17 August 2016; Accepted: 07 November 2016;
Published: 28 November 2016
Edited by:
Lothar Wondraczek, University of Jena, GermanyCopyright: © 2016 Luo, Lezzi, Vargheese, Tandia, Harris, Gross and Mauro. This is an open-access article distributed under the terms of the Creative Commons Attribution License (CC BY). The use, distribution or reproduction in other forums is permitted, provided the original author(s) or licensor are credited and that the original publication in this journal is cited, in accordance with accepted academic practice. No use, distribution or reproduction is permitted which does not comply with these terms.
*Correspondence: Jian Luo, luoj2@corning.com;
John C. Mauro, mauroj@corning.com