
A Well-Mixed Computational Model for Estimating Room Air Levels of Selected Constituents from E-Vapor Product Use

Abstract
:
1. Introduction
2. Methods
2.1. Physical Basis of the Model
2.2. Mathematical Representation
2.3. Input Variables
3. Results and Discussion
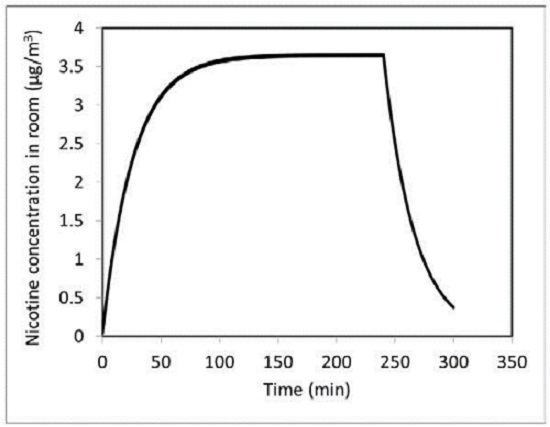
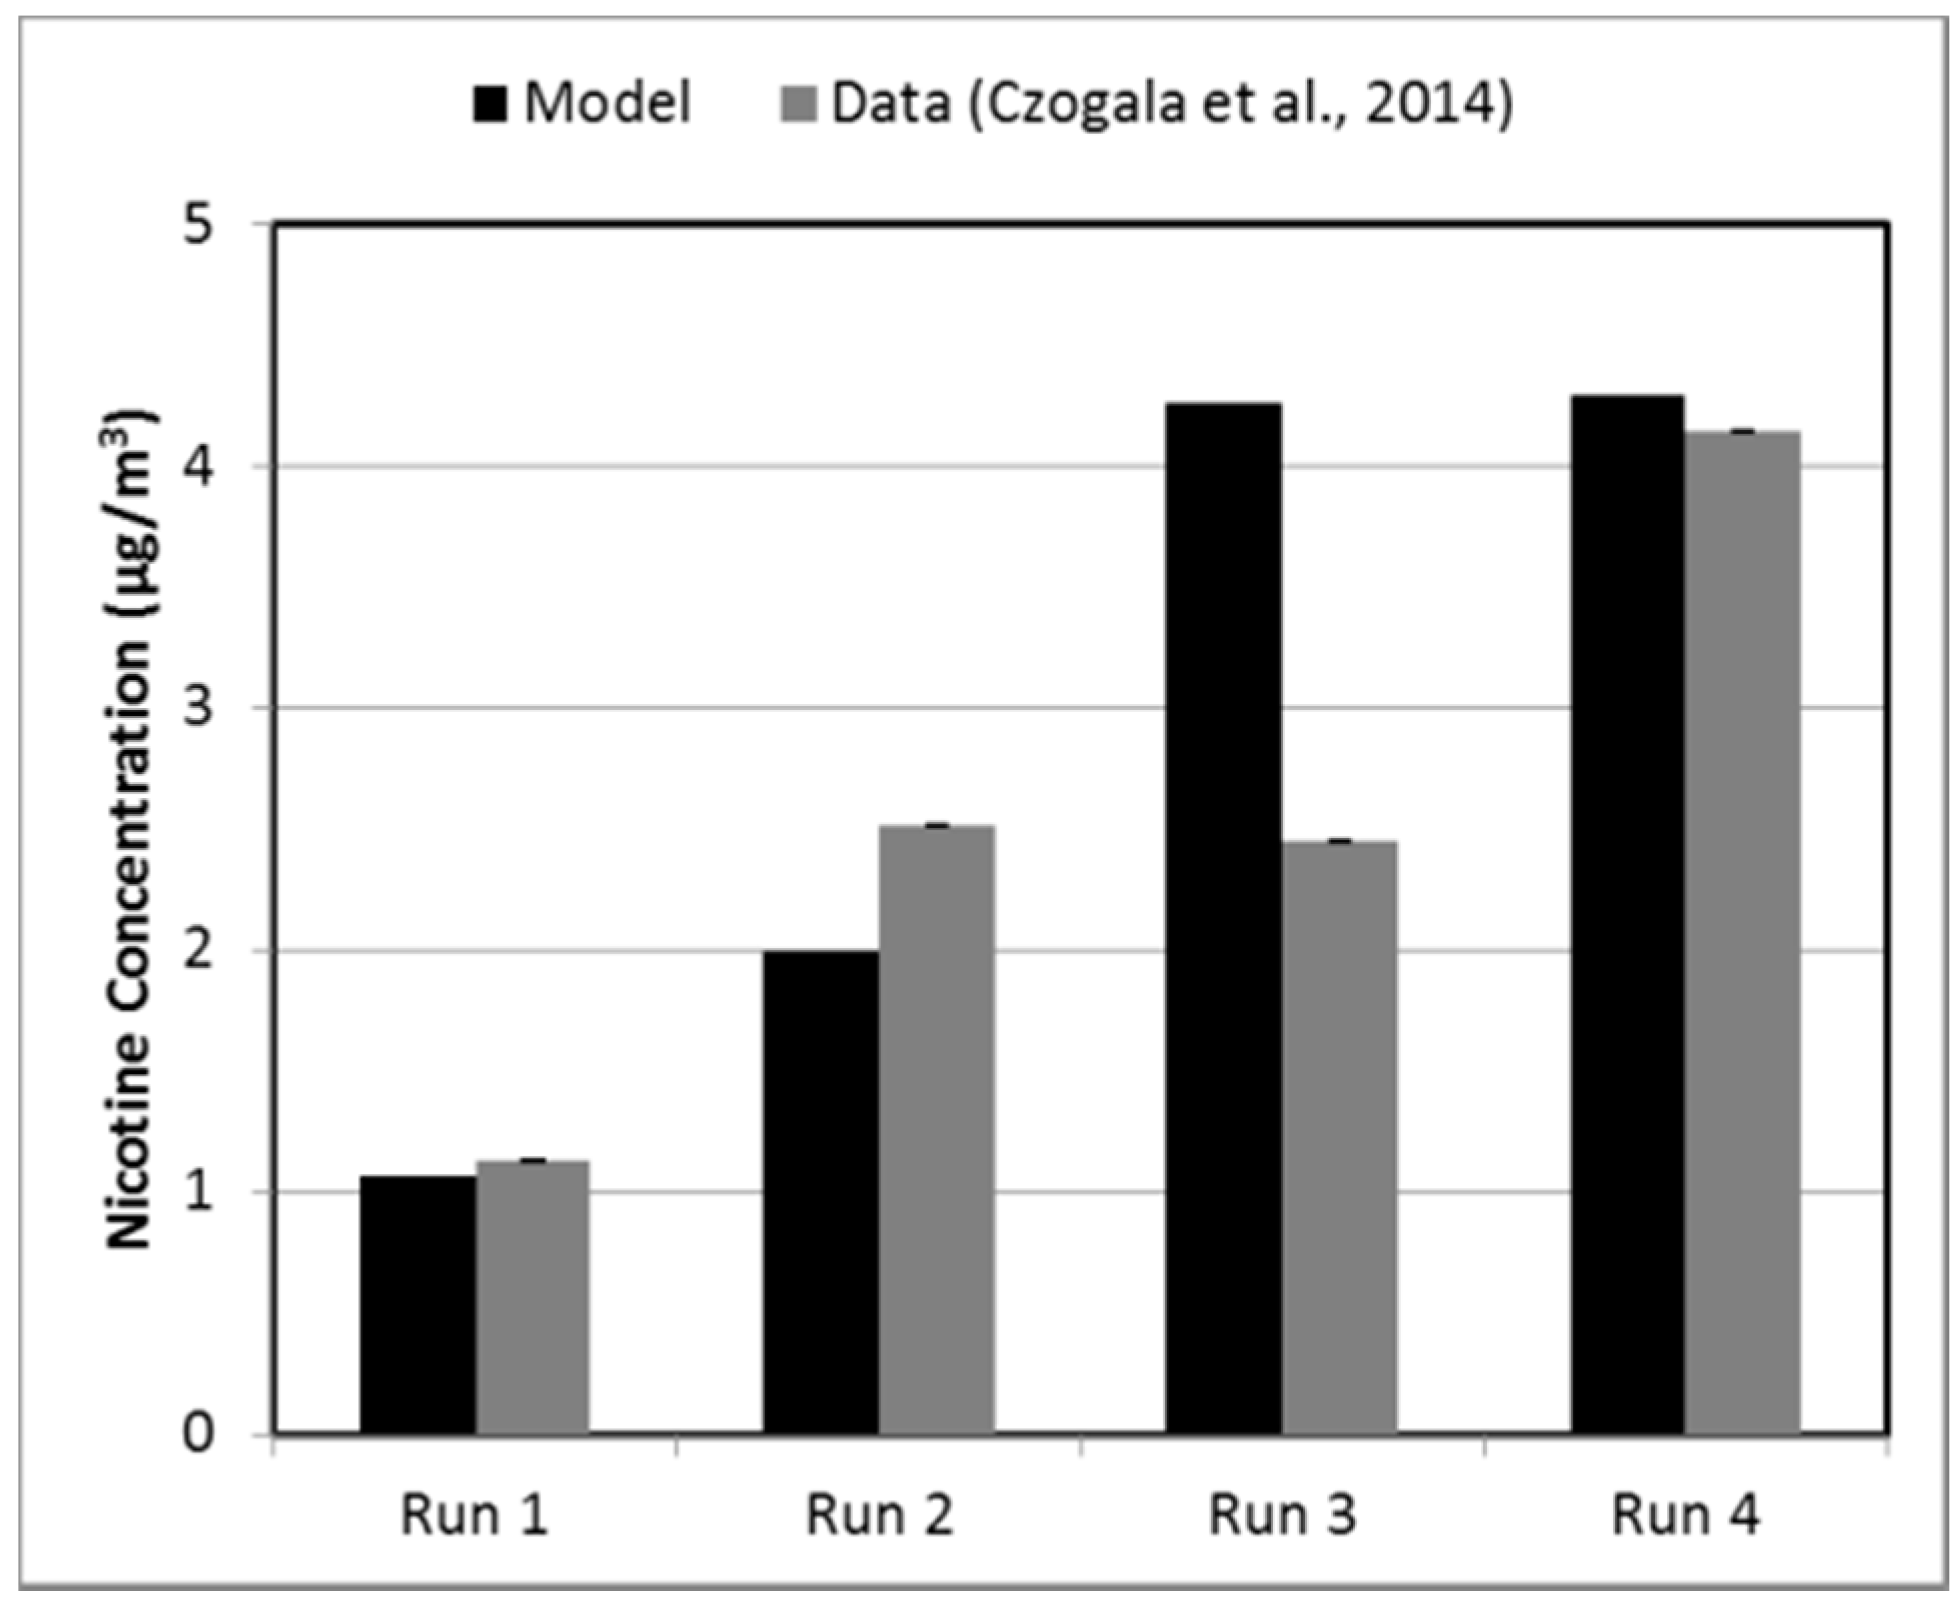
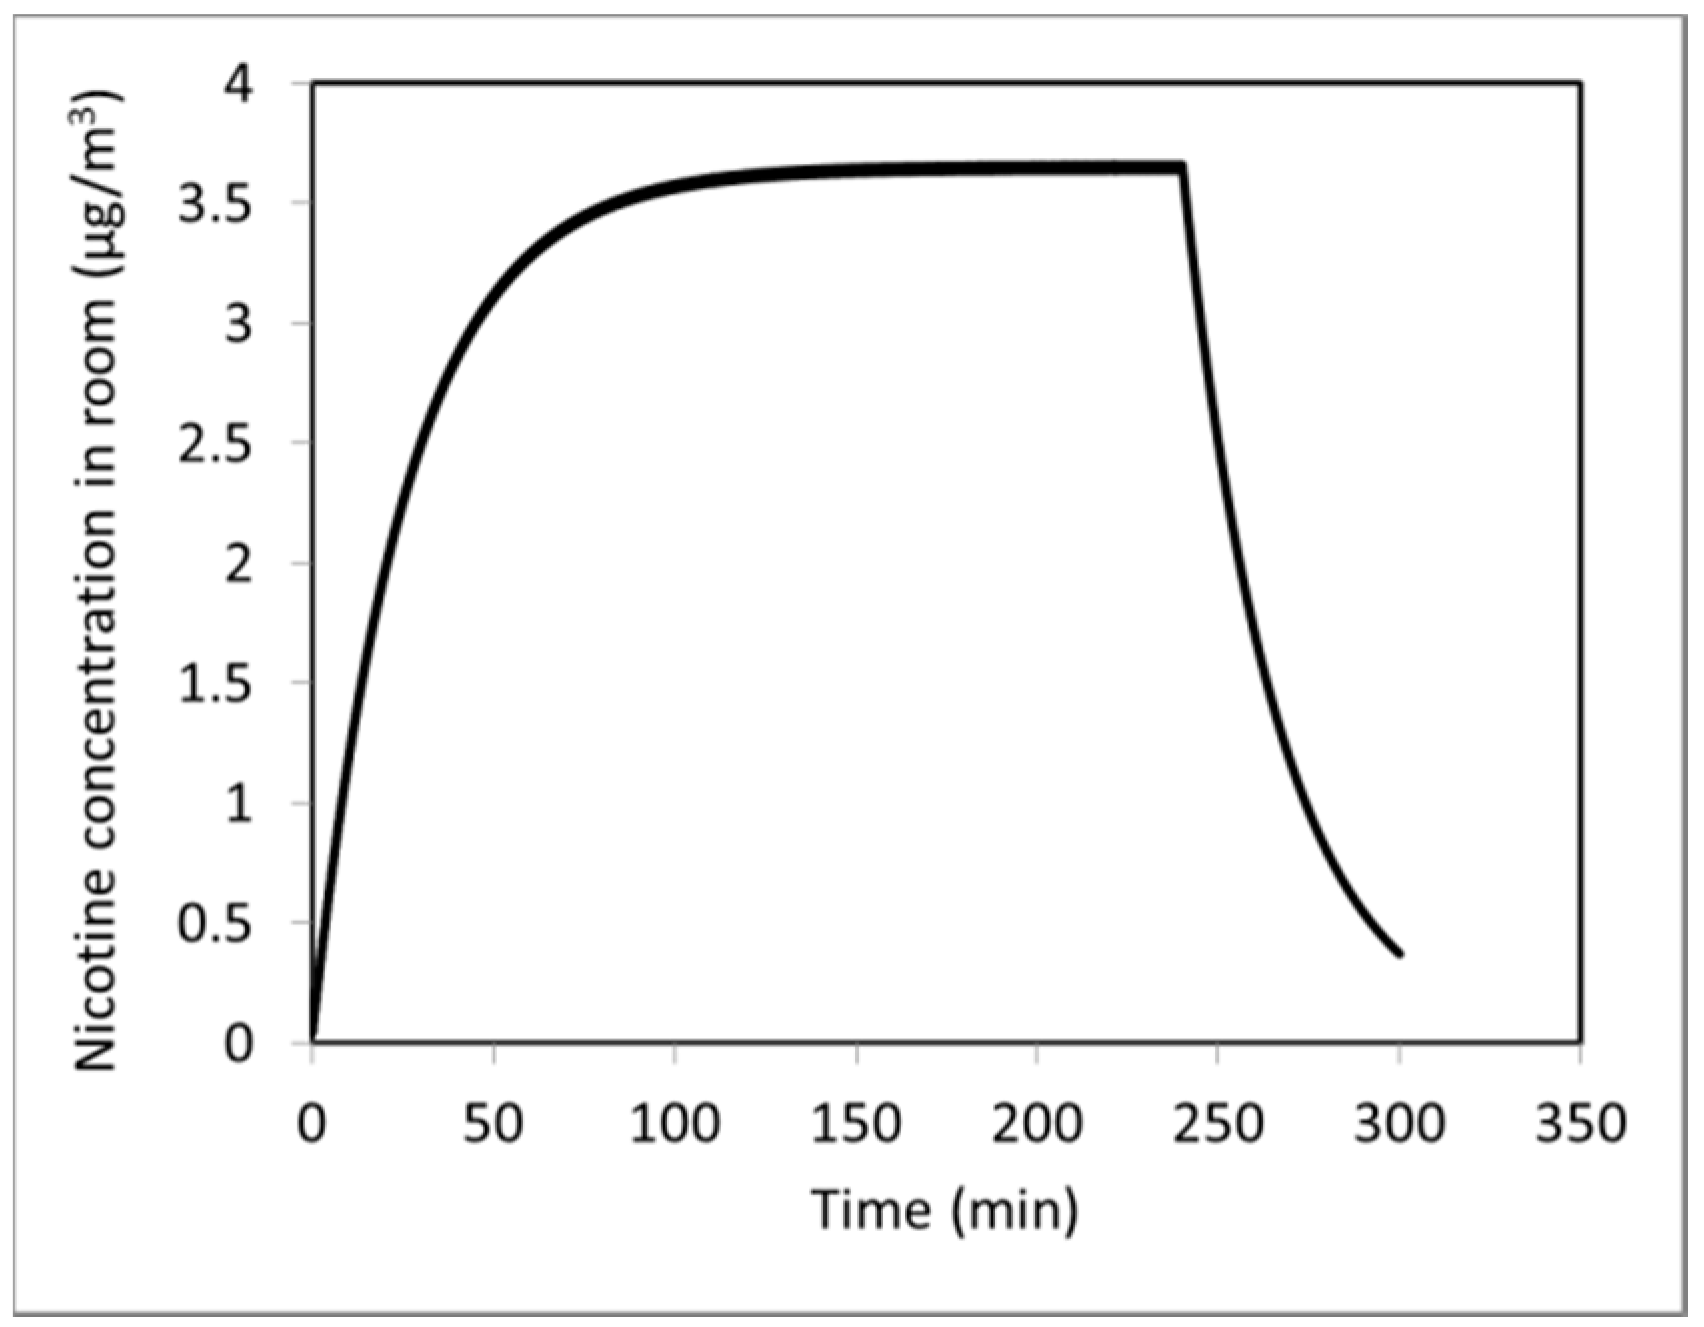
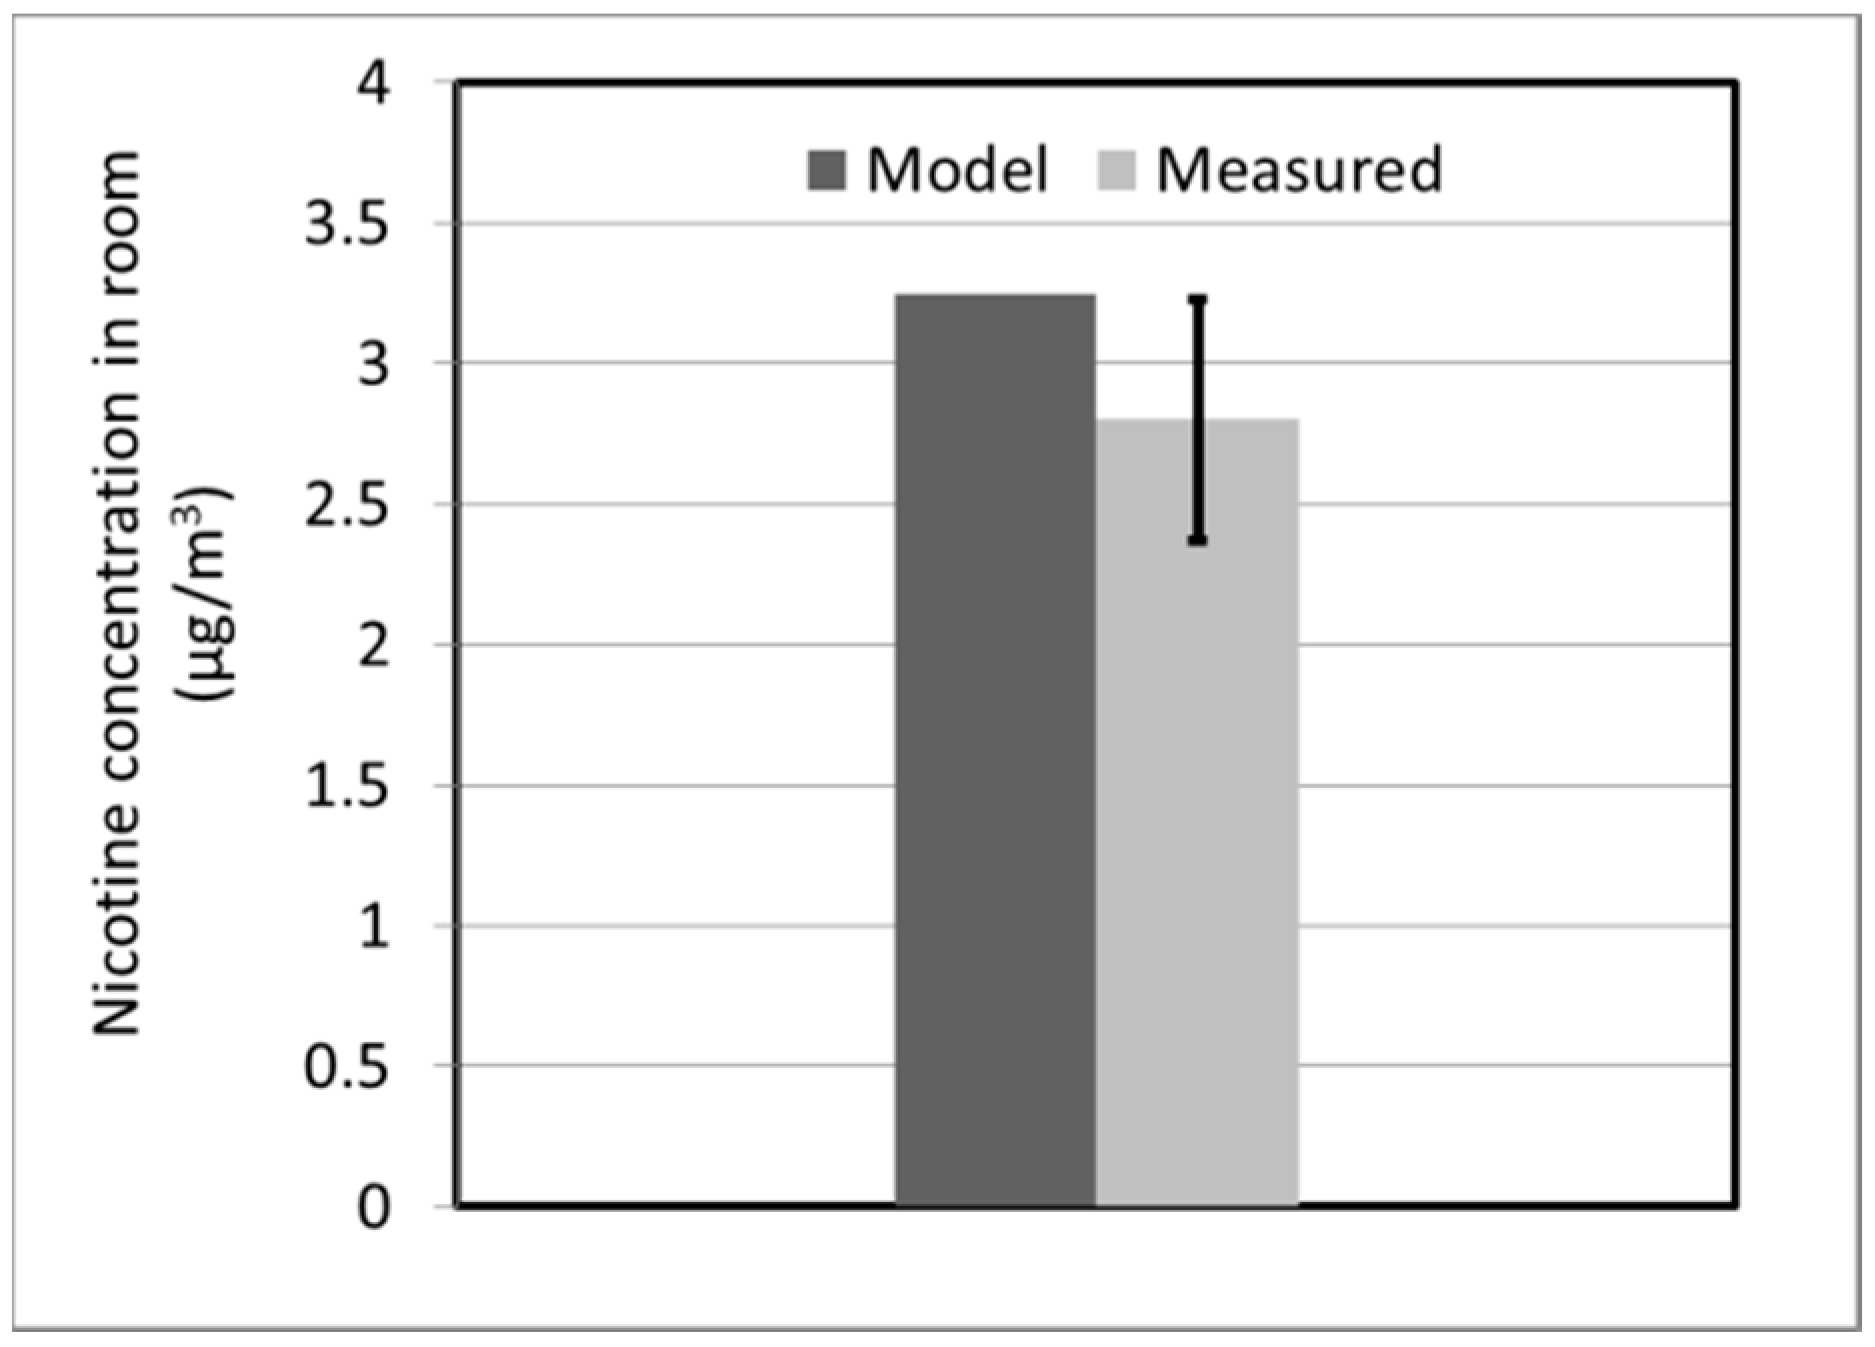
3.1. Smoking Machine-Generated Aerosol Source
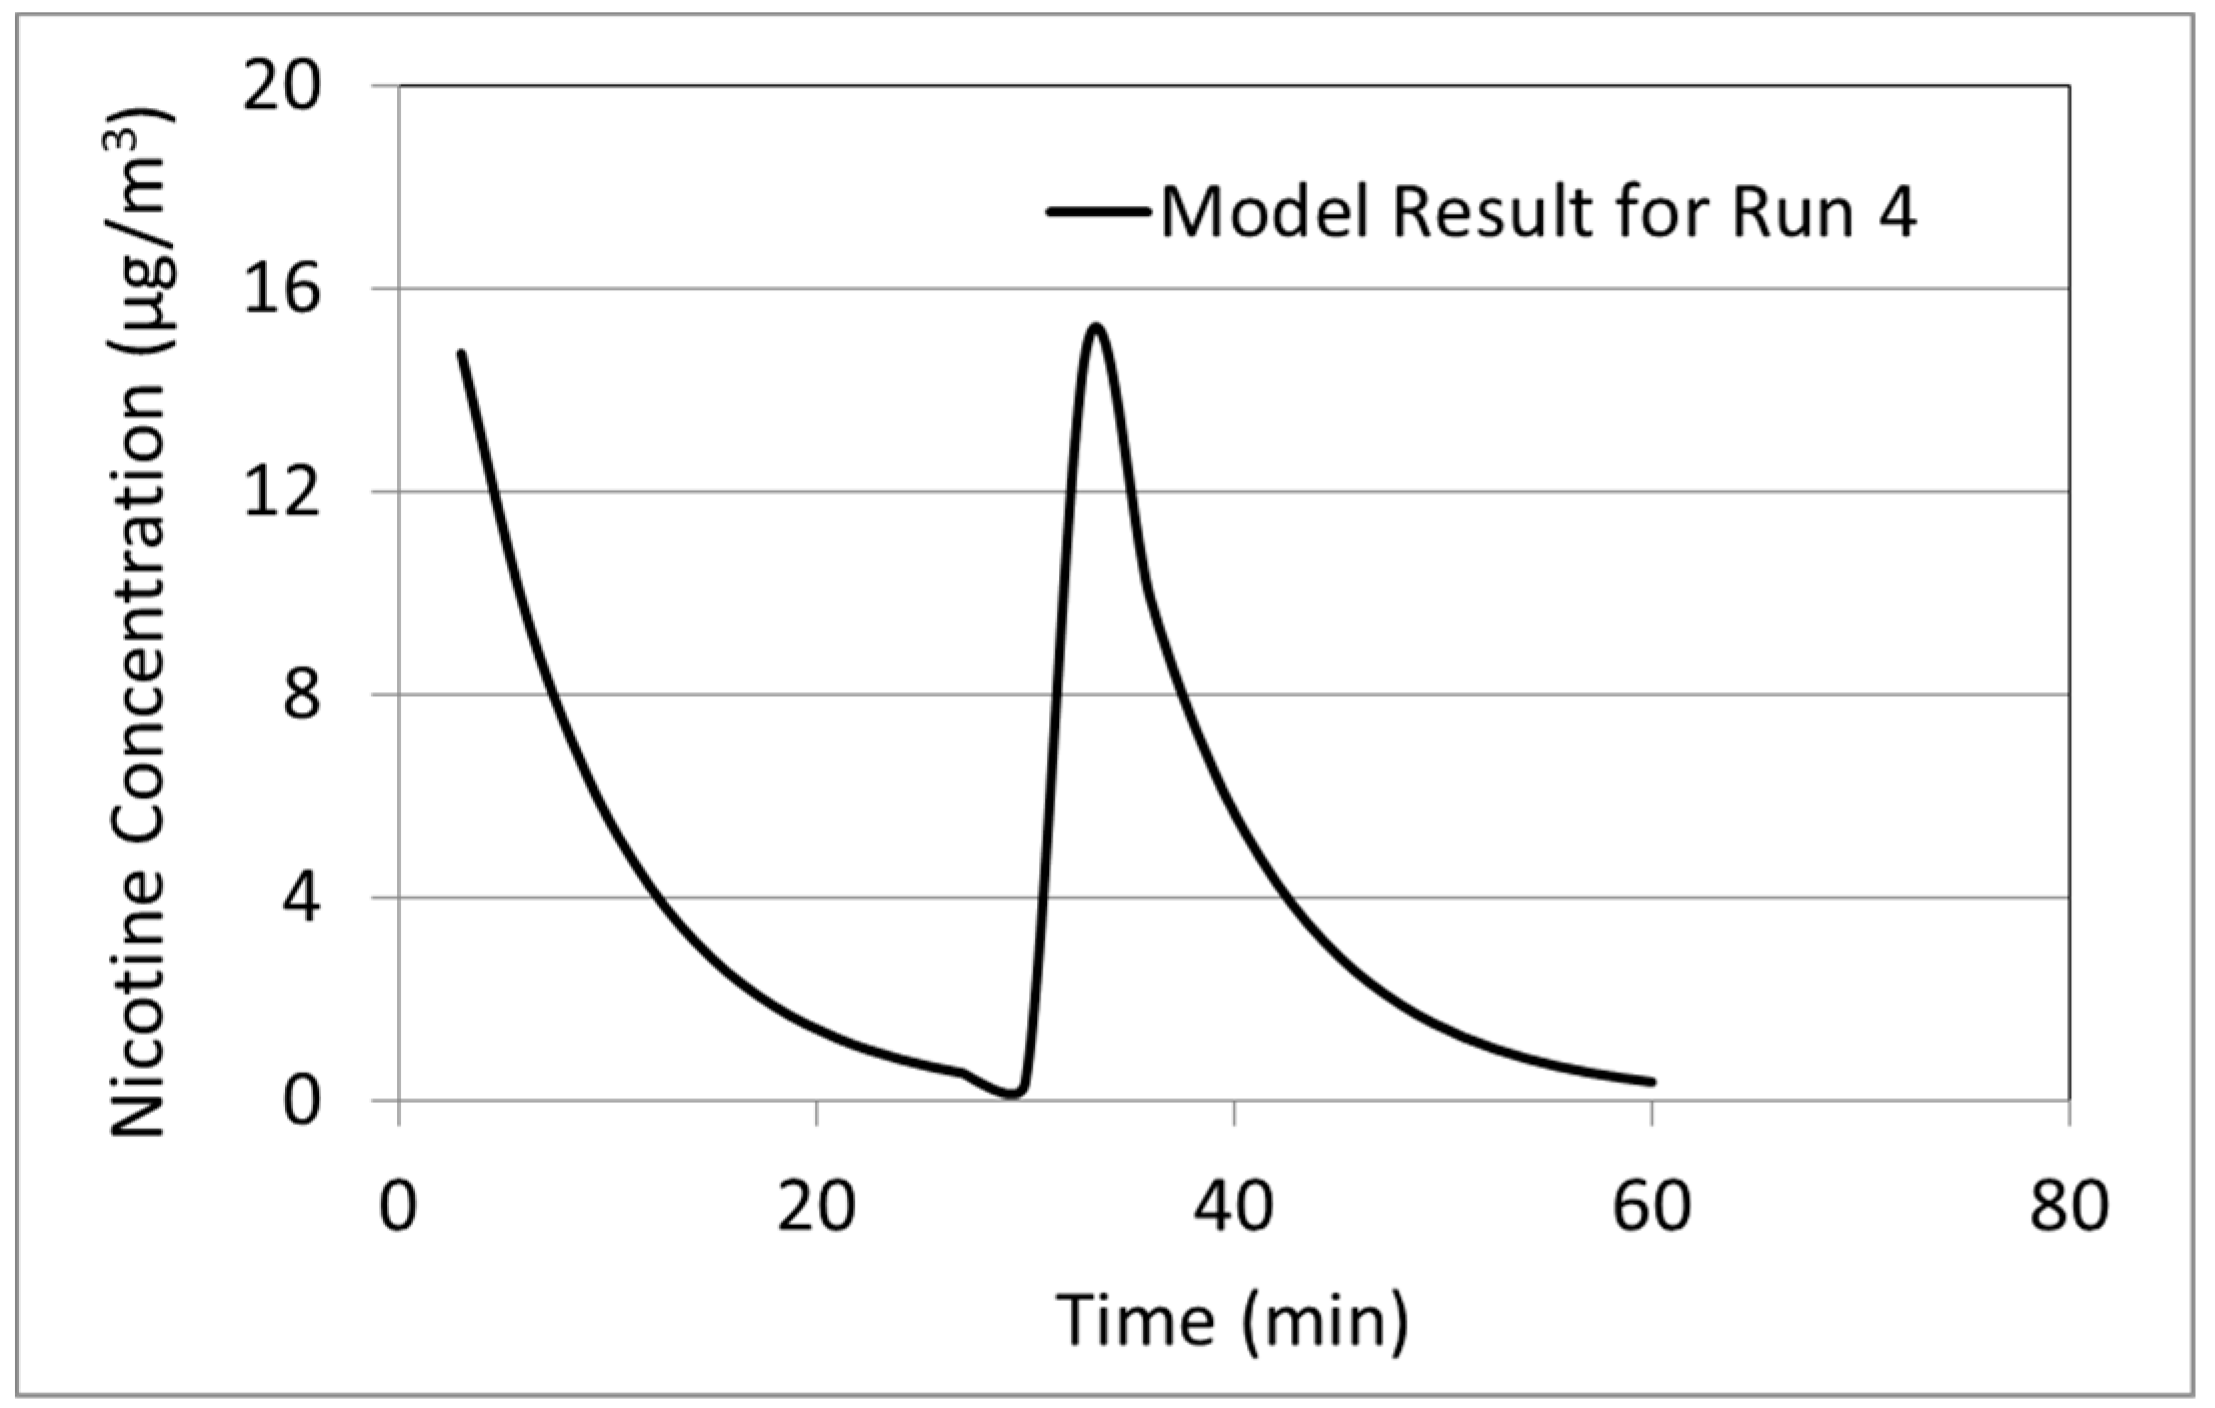
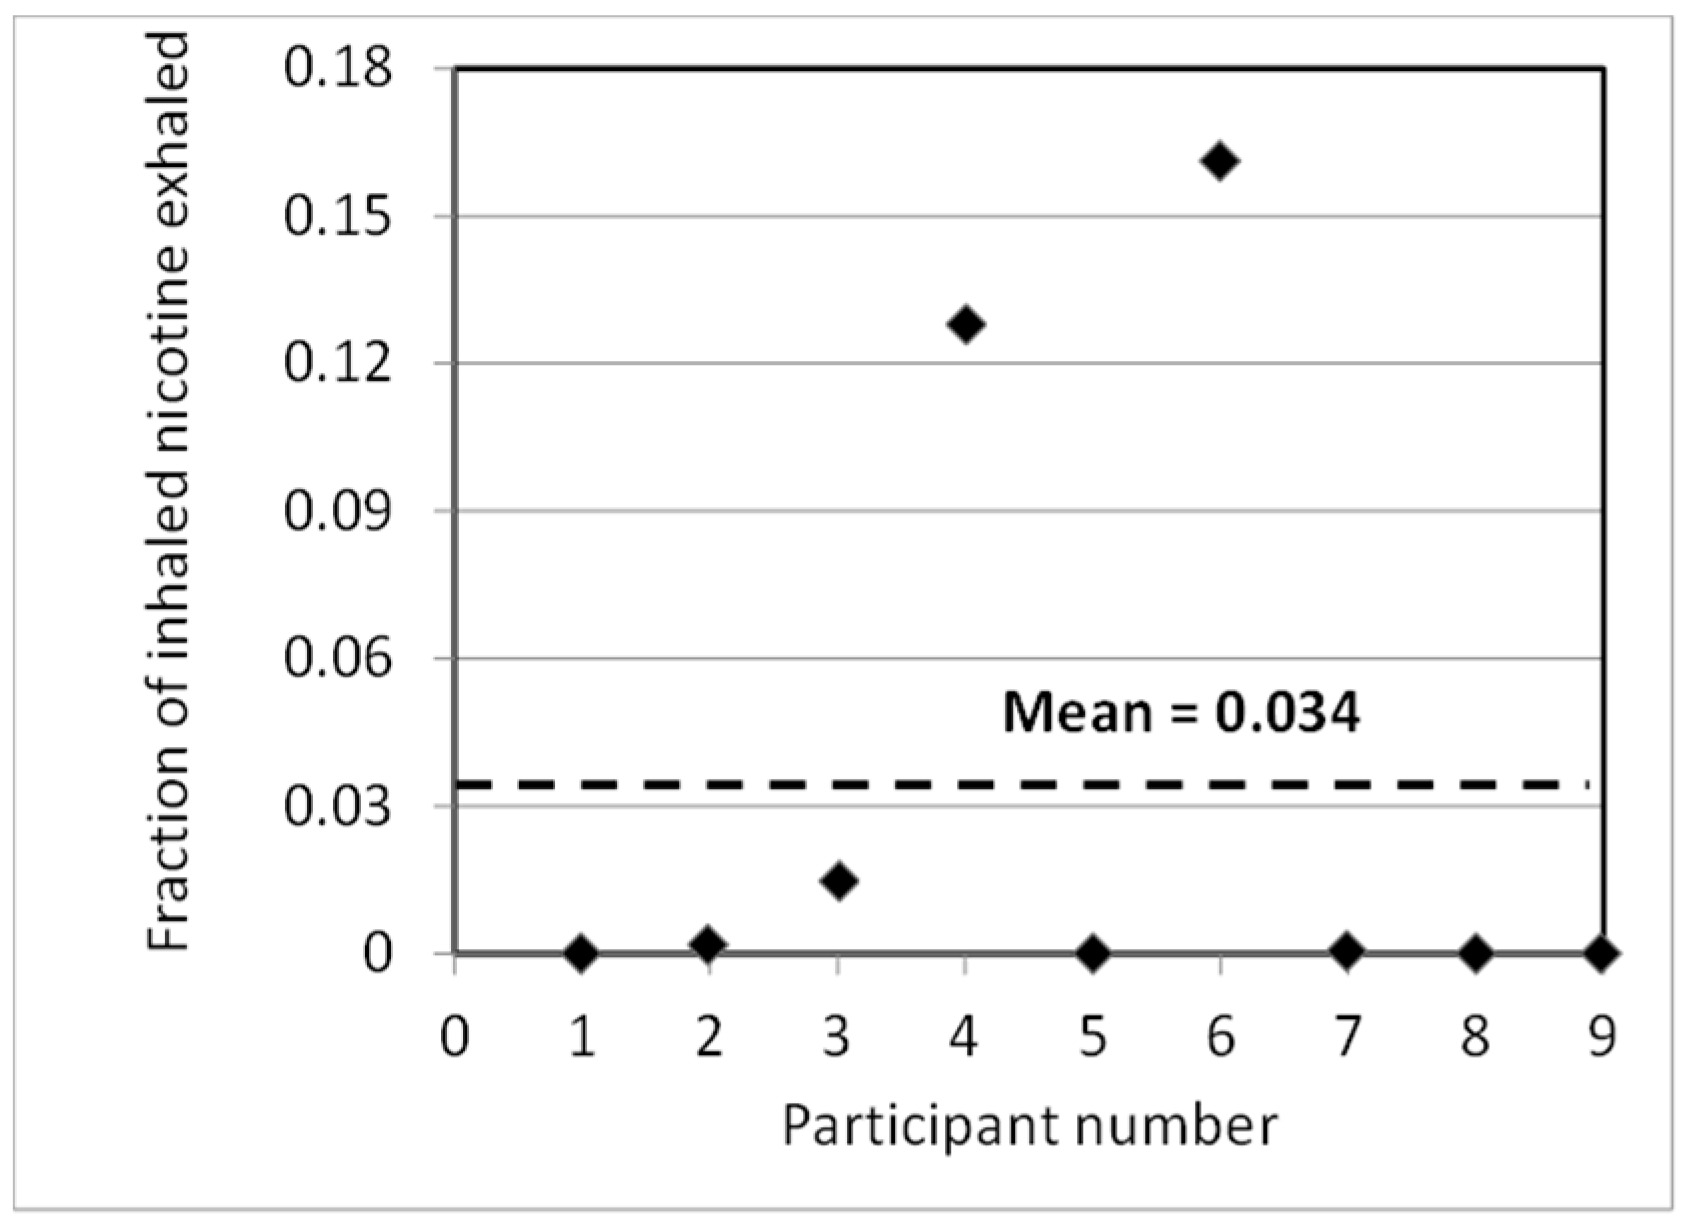
3.2. Exhaled Aerosol Source
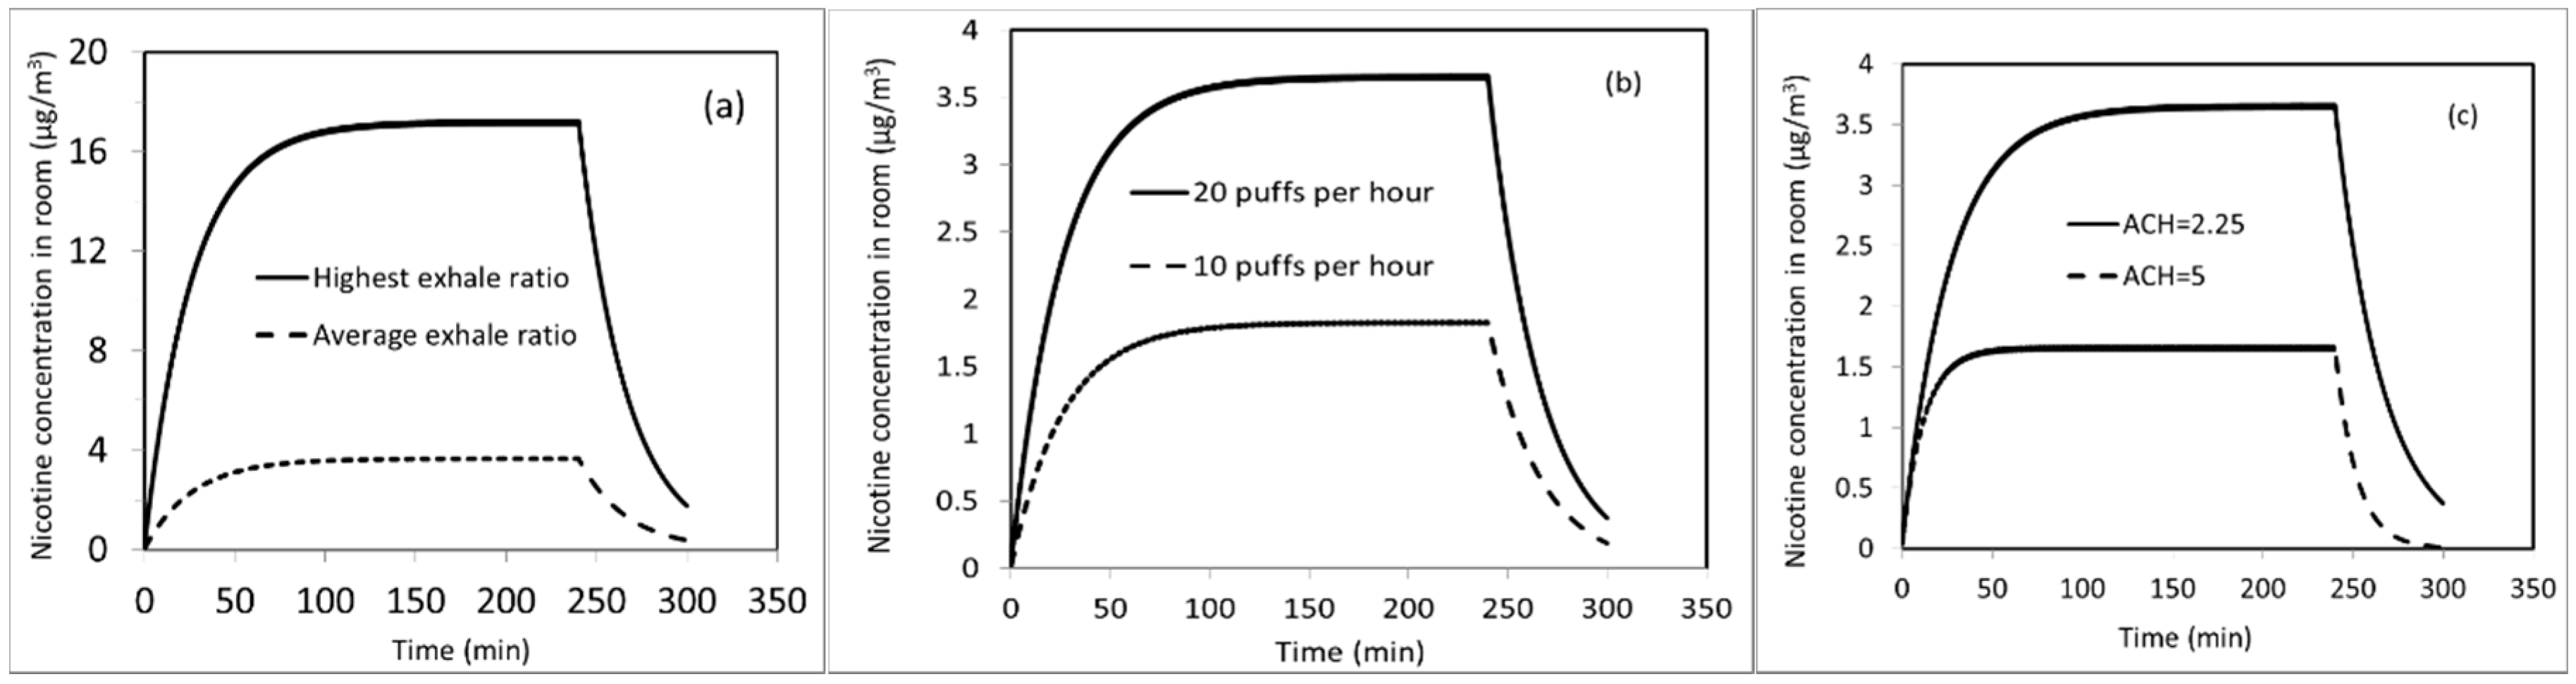
3.3. Examples of Sensitivity Analysis
4. Conclusions
Acknowledgments
Author Contributions
Conflicts of Interest
Abbreviations
| ACH | air change per hour |
| CFD | computational fluid dynamics |
| CO | carbon monoxide |
| EBC | exhaled breath condensate |
| EBS | exhaled breath system |
| EPA | US Environmental Protection Agency |
| EVP | e-vapor product |
| FDA | U.S. Food and Drug Administration |
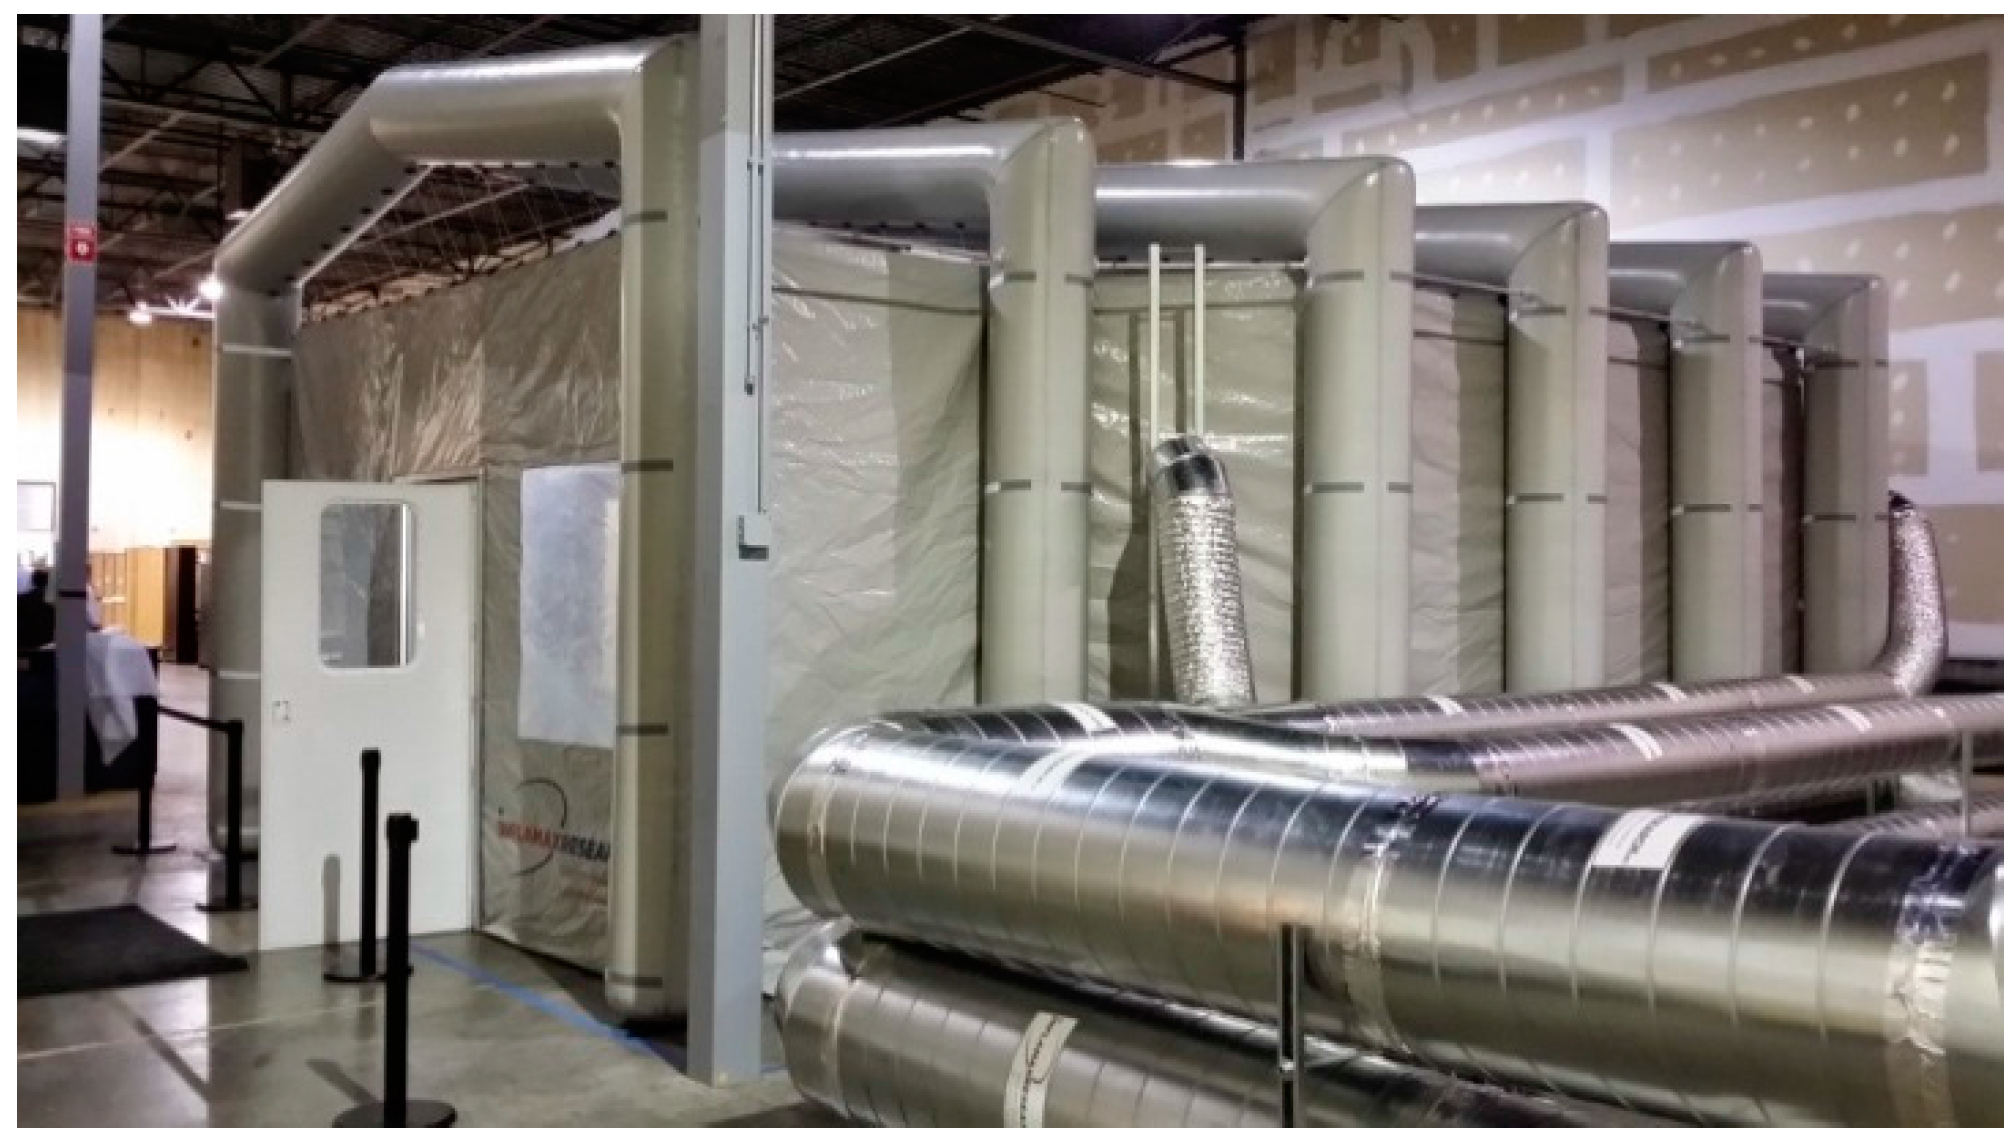
| mEEC | mobile environmental exposure chamber |
| PAH | polycyclic aromatic hydrocarbons |
| VOC | volatile organic constituent |
Nomenclature
| mvi | mass of vapor of constituent i in indoor space at time t (kg) |
| mli | mass of liquid of constituent i in indoor space at time t (kg) |
| mi | mass of constituent i in indoor space at time t (kg) |
| Ci | concentration of constituent i in indoor space (kg/m3) |
| Vr | volume of indoor space (m3) |
| Qa | air ventilation (m3/s) |
| t | time (s) |
| γi | activity coefficient (dimensionless) |
| xi | mole fraction of i in particle, liquid phase |
| yi | mass fraction of i in particle, liquid phase |
| Psat | saturation pressure at given temperature (kPa) |
| R | universal gas constant (kJ/(kmol·K)) |
| T | temperature (K) |
| Mi | molecular mass of i (kg/kmol) |
| M | molecular mass of the mixture in particle (liquid phase) (kg/kmol) |
| ρ | density of vapor of i in air (kg/m3) |
References
- Chang, H. Research gaps related to the environmental impacts of electronic cigarettes. Tob. Control 2014, 23, ii54–ii58. [Google Scholar] [CrossRef] [PubMed]
- Beard, E.; Brown, J.; McNeill, A.; Michie, S.; West, R. Has growth in electronic cigarette use by smokers been responsible for the decline in use of licensed nicotine products? Findings from repeated cross-sectional surveys. Thorax 2015, 70, 974–978. [Google Scholar] [CrossRef] [PubMed]
- Walton, K.M.; Abrams, D.B.; Bailey, W.C.; Clark, D.; Connolly, G.N.; Djordjevic, M.V.; Eissenberg, T.E.; Fiore, M.C.; Goniewicz, M.L.; Haverkos, L.; et al. NIH electronic cigarette workshop: Developing a research agenda. Nicotine Tob. Res. 2015, 17, 259–269. [Google Scholar] [CrossRef] [PubMed]
- EPA Predictive Models and Tools for Assessing Chemicals under the Toxic Substances Control Act (TSCA). Available online: http://www.epa.gov/tsca-screening-tools (accessed on 10 February 2016).
- National Research Council Committee on Indoor Pollutants. Indoor Pollutants; National Academies Press: Washington, DC, USA, 1981. [Google Scholar]
- EPA Simulation Program i-SVOC User’s Guide, EPA 600/R-13/212, November 2013. Available online: http://nepis.epa.gov/Exe/ZyPDF.cgi/P100HYEF.PDF?Dockey=P100HYEF.PDF (accessed on 10 February 2016).
- EPA Air Quality Models. Available online: http://www3.epa.gov/ttn/scram/aqmindex.htm (accessed on 10 February 2016).
- EPA Indoor Air Quality Modeling. Available online: http://www.epa.gov/nrmrl/appcd/mmd/iaq.html (accessed on 10 April 2014).
- US National Inst. Of Standards and Technology, Multizone Airflow and Contaminant Transport Analsys Software (CONTAM). Available online: http://www.bfrl.nist.gov/IAQanalysis/software/index.htm (accessed on 10 July 2016).
- FDA Modified Risk Tobacco Product Applications: Draft Guidance. Available online: http://www.fda.gov/downloads/TobaccoProducts/Labeling/RulesRegulationsGuidance/UCM297751.pdf (accessed on 10 February 2016).
- Talih, S.; Balhas, Z.; Eissenberg, T.; Salman, R.; Karaoghlanian, N.; El Hellani, A.; Baalbaki, R.; Saliba, N.; Shihadeh, A. Effects of user puff topography, device voltage, and liquid nicotine concentration on electronic cigarette nicotine yield: Measurements and model predictions. Nicotine Tob. Res. 2015, 17, 150–157. [Google Scholar] [CrossRef] [PubMed]
- Colard, S.; O’Connell, G.; Verron, T.; Cahours, X.; Pritchard, J.D. Electronic cigarettes and indoor air quality: a simple approach to modeling potential bystander exposures to nicotine. Int. J. Environ. Res. Public Health 2015, 12, 282–299. [Google Scholar] [CrossRef] [PubMed]
- Long, G.A. Comparison of select analytes in exhaled aerosol from e-cigarettes with exhaled smoke from a conventional cigarette and exhaled breaths. Int. J. Environ. Res. Public Health 2014, 11, 11177–11191. [Google Scholar] [CrossRef] [PubMed]
- Bertholon, J.F.; Becquemin, M.H.; Roy, M.; Roy, F.; Ledur, D.; Annesi Maesano, I.; Dautzenberg, B. Comparison of the aerosol produced by electronic cigarettes with conventional cigarettes and the shisha. Rev. Mal. Respir. 2013, 30, 752–757. [Google Scholar] [CrossRef] [PubMed]
- Liu, J.; Oldham, M.J.; Sarkar, M.A.; Rostami, A.A. Altria Client Services LLC, Richmond, VA 23219, USA. Determination of levels of selected constituents in exhaled breath from the use of cartridge, tank-based e-vapor products or conventional cigarettes by adult tobacco product users. Unpublished data. 2016. [Google Scholar]
- Hess, I.M.R.; Lachireddy, K.; Capon, A. A systematic review of the health risks from passive exposure to electronic cigarette vapour. Public Health Res. Pract. 2016, 26, e2621617. [Google Scholar] [CrossRef]
- O’Connell, G.; Colard, S.; Cahours, X.; Pritchard, J.D. An assessment of indoor air quality before, during and after unrestricted use of e-cigarettes in a small room. Int. J. Environ. Res. Public Health 2015, 12, 4889–4907. [Google Scholar] [CrossRef] [PubMed]
- Romagna, G.; Zabarini, L.; Barbiero, L.; Boccietto, E.; Todeschi, S.; Caravati, E. Characterization of Chemicals Released to the Environment by Electronic Cigarettes Use (ClearStream-AIR Project): Is Passive Vaping a Reality? In Proceedings of the XIV Annual Meeting of the Society for Research on Nicotine and Tobacco Europe, Helsinki, Finland, 1 September 2012.
- Schober, W.; Szendrei, K.; Matzen, W.; Osiander-Fuchs, H.; Heitmann, D.; Schettgen, T.; Jorres, R.A.; Fromme, H. Use of electronic cigarettes (e-cigarettes) impairs indoor air quality and increases FeNO levels of e-cigarette consumers. Int. J. Hyg. Environ. Health 2014, 217, 628–637. [Google Scholar] [CrossRef] [PubMed]
- Farsalinos, K.E.; Voudris, V. E-cigarette use and indoor air quality: Methodological limitations: Response to W. Schober et al.’s “Use of electronic cigarettes (e-cigarettes) impairs indoor air quality and increases FeNO levels of e-cigarette consumers”. Int. J. Hyg. Environ. Health 2014, 217, 705–706. [Google Scholar] [CrossRef] [PubMed]
- Schripp, T.; Markewitz, D.; Uhde, E.; Salthammer, T. Does e-cigarette consumption cause passive vaping? Indoor Air 2013, 23, 25–31. [Google Scholar] [CrossRef] [PubMed]
- Fenske, J.D.; Paulson, S.E. Human breath emissions of VOCs. J. Air Waste Manag. Assoc. 1999, 49, 594–598. [Google Scholar] [CrossRef] [PubMed]
- Popov, T.A. Human exhaled breath analysis. Ann. Allergy Asthma Immunol. 2011, 106, 451–456. [Google Scholar] [CrossRef] [PubMed]
- Maloney, J.C.; Thompson, M.K.; Oldham, M.J.; Stiff, C.L.; Lilly, P.D.; Patskan, G.J.; Shafer, K.H.; Sarkar, M.A. Insights from two industrial hygiene pilot e-cigarette passive vaping studies. J. Occup. Environ. Hyg. 2015. [Google Scholar] [CrossRef] [PubMed]
- Oldham, M.J.; Wagner, K.A.; Gilman, G.; Beach, J.; Liu, J.; Rostami, A.A.; Sarkar, M.A. Altria Client Services LLC, Richmond, VA 23219, USA. Development/verification of methods for measurement of exhaled breath and environmental e-cigarette vapor. Unpublished data. 2016. [Google Scholar]
- Czogala, J.; Goniewicz, M.L.; Fidelus, B.; Zielinska-Danch, W.; Travers, M.J.; Sobczak, A. Secondhand exposure to vapors from electronic cigarettes. Nicotine Tob. Res. 2014, 16, 655–662. [Google Scholar] [CrossRef] [PubMed]
- Rostami, A.A.; Agyemang, S.; Pithawalla, Y.B. A distributed computational fluid dynamics (CFD) model for estimation of room air levels of selected aerosol chemicals from emission of E-vapor products (EVP). In Proceedings of the Coresta Conference, Berlin, Germany, 9–13 October 2016.
- Ingebrethsen, B.J.; Cole, S.K.; Alderman, S.L. Electronic cigarette aerosol particle size distribution measurements. Inhal. Toxicol. 2012, 24, 976–984. [Google Scholar] [CrossRef] [PubMed]
- Goniewicz, M.L.; Kuma, T.; Gawron, M.; Knysak, J.; Kosmider, L. Nicotine levels in electronic cigarettes. Nicotine Tob. Res. 2013, 15, 158–166. [Google Scholar] [CrossRef] [PubMed]
- Sarkar, M.; Liu, J.; Liang, Q.; Peng, X.; Oldham, M.; Rostami, A.; Wagner, K.; Gillman, G.; Salapatek, A.M. Are Chemical Constituents Exhaled in a Room Where E-Vapor Products Are Used? In Proceedings of the 69th Tobacco Science Research Conference (TSRC), Naples, FL, USA, 20 September 2015.
- US Department of Labor Occupational Safety and Health Administration regulations. Available online: https://www.osha.gov/pls/oshaweb/owadisp.show_document?p_table=STANDARDS&p_id=9992 (accessed on 5 January 2016).
- Fernandez, E.; Ballbe, M.; Sureda, X.; Fu, M.; Salto, E.; Martinez-Sanchez, J.M. Particulate matter from electronic cigarettes and conventional cigarettes: A systematic review and observational study. Curr. Environ. Health Rep. 2015, 2, 423–429. [Google Scholar] [CrossRef] [PubMed]


| Run Number 1 | Nicotine Level in E-Liquid (%) | Aerosol Release | Ventilation Level (ACH) 2 |
|---|---|---|---|
| 1 | 1.8 | Low (7 puffs) | 9.86 |
| 2 | 1.8 | Low (7 puffs) | 6.81 |
| 3 | 1.8 | High (15 puffs) | 6.83 |
| 4 | 1.8 | High (15 puffs) | 6.80 |
© 2016 by the authors; licensee MDPI, Basel, Switzerland. This article is an open access article distributed under the terms and conditions of the Creative Commons Attribution (CC-BY) license (http://creativecommons.org/licenses/by/4.0/).
Share and Cite
Rostami, A.A.; Pithawalla, Y.B.; Liu, J.; Oldham, M.J.; Wagner, K.A.; Frost-Pineda, K.; Sarkar, M.A. A Well-Mixed Computational Model for Estimating Room Air Levels of Selected Constituents from E-Vapor Product Use. Int. J. Environ. Res. Public Health 2016, 13, 828. https://doi.org/10.3390/ijerph13080828
Rostami AA, Pithawalla YB, Liu J, Oldham MJ, Wagner KA, Frost-Pineda K, Sarkar MA. A Well-Mixed Computational Model for Estimating Room Air Levels of Selected Constituents from E-Vapor Product Use. International Journal of Environmental Research and Public Health. 2016; 13(8):828. https://doi.org/10.3390/ijerph13080828
Chicago/Turabian StyleRostami, Ali A., Yezdi B. Pithawalla, Jianmin Liu, Michael J. Oldham, Karl A. Wagner, Kimberly Frost-Pineda, and Mohamadi A. Sarkar. 2016. "A Well-Mixed Computational Model for Estimating Room Air Levels of Selected Constituents from E-Vapor Product Use" International Journal of Environmental Research and Public Health 13, no. 8: 828. https://doi.org/10.3390/ijerph13080828