
 "Decoding DMK’s loss in Tamil Nadu polls: Conspiracy theory or alliance math gone wrong?")
M Karunanidhi blamed the All India Anna Dravida Munnetra Kazhagam (ADMK), the Centre and the Election Commission of conspiring to defeat the Dravida Munnetra Kazhagam (DMK) in the recently concluded Tamil Nadu polls. As with most political theories, Karunanaidhi’s conspiracy claim was also not backed by any evidence. In fact, the truth is far simpler; the DMK’s defeat can be attributed to an alliance math that went wrong.
To put things in perspective, this election was a game changer for two reasons. One, J Jayalalithaa created history by getting re-elected in a state that, since 1984, has never seen an incumbent return to power. Two, since Tamil Nadu elections are usually one-sided affairs with either the ADMK or DMK toppling the other, DMK’s performance was exceptional for an opposition party. In light of this, our analysis uses constituency-level data to glean insights on DMK’s performance.
Having fallen out with former allies like Desiya Murpokku Dravida Kazhagam (DMDK) and the Left after the 2011 election, ADMK went solo in 2016. The Congress tied up with its existing ally, DMK, contesting 41 seats, down from 63 in the previous election. With the BJP contesting 187 constituencies, it became a six-cornered fight (including PMK and the Vijaykant-led Third Front), which turned out to be disastrous for all but the two regional giants.
Though the ADMK won the election, its victory was not overwhelming. The margin of victory can be seen narrowing for the first time in 15 years. The margin of victory is the difference between the strike rate of ADMK and DMK. The strike rate is the total number of seats won by a party in proportion to the total number of seats contested by it in that election.
ADMK won in 2001, 2011, 2014, 2016 but the margin of victory has been the smallest this year – 57 percent for ADMK v/s 50 percent for DMK.
We then dug into the individual seat and vote-share patterns to understand the nature of DMK’s loss.
In the above matrix, the first row depicts the strike rate of the ADMK against each DMK alliance partner.
In the 178 seats where ADMK competed one on one with DMK, ADMK and DMK, each had a 50 percent strike rate. ADMK did win this election but our analysis shows that the source of the victory is the poor performance of DMK’s allies. It can be seen in ADMK’s 80 percent strike rate against the INC and 92 percent against others.
Among the constituencies where DMK did not contest this year, there were 14 constituencies where DMK had a candidate in 2011. In these constituencies their vote-share was 40 percent in 2011, whereas its allies got 34 percent this year. Hypothetically, if they had maintained the same average in these 14 seats (and given that ADMK lost an average of 10 percent vote-share in all seats where it went directly against DMK), DMK could have ended up with 14 more seats which would have reduced ADMK’s tally to 121 and increased DMK’s to 102.
Our analysis of the constituency-wise vote shares between ADMK and DMK (with its allies) strengthens our case. The reds are constituencies where DMK+ won while greens are where ADMK won.
The grey constituencies are where vote-share between the two was less than 0.5 percent. The darker the shade, the greater the margin of ADMK’s victory in a constituency. In 80 percent of the green constituencies, ADMK had a lead of less than <10 percent - depicted by the dominant light green colour constituencies spread across the state. This is the most telling aspect of this map and of the election. It shows the DMK actually performed very well across the state, and a few changes in strategy could have flipped the election in their favour. Its loss, therefore, highlights the punitive nature of making the wrong call on electoral alliances.
_(_Rithika Kumar and Swapnil Bhandari are, respectively, Associate and Assistant Director at IDFC Institute, a Mumbai-based think/do tank.)


 "Baba Indrajith Exclusive: In-form batter says thoughts of India selection 'definitely crossed his mind’")
 "Tamil Nadu fishers ready to set sail into electoral politics amid issues with Sri Lanka")
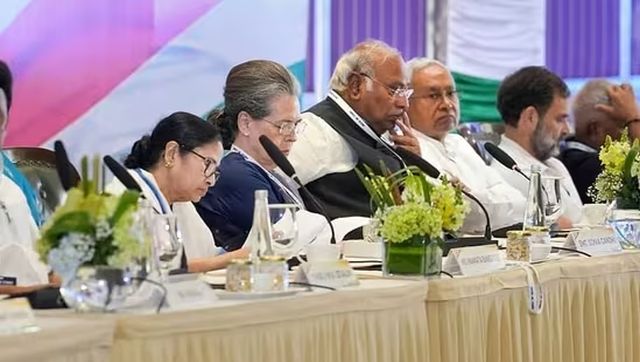
 "Limits of coalition politics: Five reasons I.N.D.I. Alliance is falling apart")
 "FirstUp: India's Budget, Germany's 4-day work week to begin... Headlines of the day")
 "Baba Indrajith Exclusive: In-form batter says thoughts of India selection 'definitely crossed his mind’")
 "Tamil Nadu fishers ready to set sail into electoral politics amid issues with Sri Lanka")
 "Limits of coalition politics: Five reasons I.N.D.I. Alliance is falling apart")
 "FirstUp: India's Budget, Germany's 4-day work week to begin... Headlines of the day")