


What’s Inside:
-GBP/USD and GBP/JPY are in potential pivot zones simultaneously
-2 tools (SSI and GSI) can help you determine a potential shift higher or continuation lower in price
-Watch equity markets for additional clues of a risk rally
The historic moves in GBP/USD (1793 pips from high to low) and GBP/JPY (2690 pips from high to low) from Friday have left many chartists scratching their heads. Trend followers love these moves, but get nervous that the move is possibly extended and overdone. Will prices bounce higher to relieve the compression?
During times like these, it is important to take a step back and look at the bigger picture. In doing so with GBP/USD and GBP/JPY, we see prices are on top of a technical pressure zone, or hot spot which simply suggests something is about to give.
GBP/USD Weekly July 2014 to Current
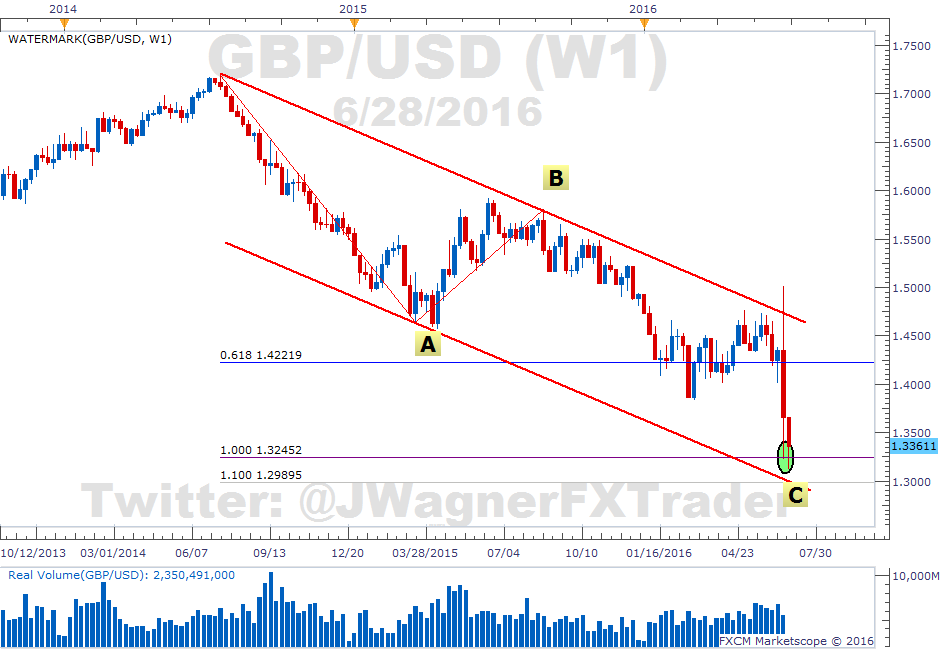
Chart prepared by Jeremy Wagner
In viewing the GBPUSD daily chart, the descending price channel stands out. We are near the lows of the channel and the pair has formed an equal wave pattern beginning July 2014. The equal wave measurement is seen as the 1.000 horizontal line on the chart. The pattern measures the length of wave “A” and projects areas for wave “C” to possibly terminate. Alternating waves like “C” versus “A” tend to have an equality relationship or Fibonacci relationship. Since prices are at an equal level, it warns a reaction higher is elevated.
The equal wave measurement is not an exact science. I’ll consider the equal wave pattern voided on a move below 1.3000 where wave “C” winds up being 110% the length of wave “A”. At that point, the door is opened to the 1.618 extension near 1.17 (not shown).
GBP/JPY Weekly Chart 2011 to Current
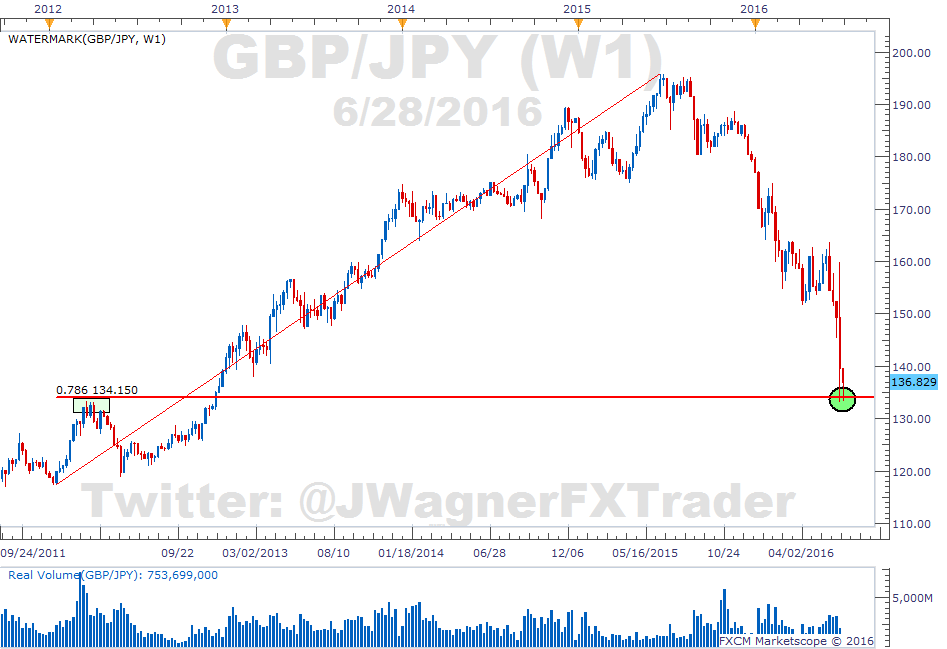
Chart prepared by Jeremy Wagner
The weekly chart for GBP/JPY is simultaneously trading near the 78.6% retracement level. This level sits at 134.15 and is considered the retracement of last resort. That means if prices don’t bounce here, then it could lead to a retest of the 2011 lows near 117.
To have two different Sterling pairs trading near a potential pivot zone is something worth raising the antennae for. We don’t know if prices will bounce higher or continue lower, but there is an elevated probability of a bounce.
How do we know if prices bounce higher or break lower?
We’ll never know for sure until after the fact. In this case we can call upon two tools to help us determine if the mood and momentum are shifting or indicating a continuation.
- Speculative Sentiment Index (SSI) – This is a contrarian tool where a shift towards a higher ratio favors shorts. A shift towards a lower ratio favors longs. The current ratio is +1.63 and you can keep track of the real time SSI here.
- Grid Sight Indicator (GSI) – This tool looks at historic intraday price patterns to see how many matches there are to the current market. When applied near support levels like indicated above, it can provide a clue if past historic moves were higher or lower. Follow GSI for GBP/USD and GBP/JPY on ‘m5’.
Yesterday, we published an article on US equities and namely Dow Jones Industrial Average. The pattern is still in a technical uptrend and dips are being considered to buy while prices are above 16,500. I mention this because higher equities prices may indicate a risk rally which may relieve the compression on GBPUSD and GBPJPY pushing them higher. Something to consider keeping an eye on equities as well.
Suggested Reading:
British Pound May Bounce as Markets Digest Brexit Blood Letting
GBP/USD Driving Equities and Volatility, Likely to Persist
Brexit Aftermath Analysis Directory
---Written by Jeremy Wagner, Head Trading Instructor, DailyFX EDU
Follow me on Twitter at @JWagnerFXTrader .
See Jeremy’s recent articles at his Bio Page.
To receive additional articles from Jeremy via email, join Jeremy’s distribution list.


