
 "India hits eight-year high in FDI inflows, says Unctad report")
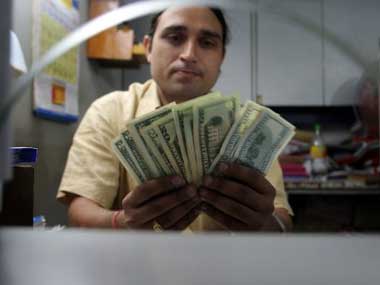
Global foreign direct investment (FDI) jumped to $1.76 trillion in 2015 while foreign investment inflows to India reached a high of $44 billion almost touching record levels of 2008, a new UN report released on Tuesday shows .
The UN trade agency’s annual report on global FDI trends for 2015 has come only a day after the Narendra Modi government announced sweeping reforms in foreign investment rules.
Inflows up, outflows down in India
With inflows reaching $44 billion in 2015, the bounce-back in inward FDI to India continues after a sharp drop in 2012 (from $36bn in 2011) and gradually increasing 2013 onwards.
“After a nadir of $24 billion in 2012, the 2015 level is within shouting distance of the peak of $47 billion attained in 2008. As a result of rising FDI in India, total inflows to South Asia increased by about 22 percent to $50 billion — surpassing FDI into West Asia,” Dr James Zhan, director of investment and enterprise at the United Nations Conference on Trade and Development (Unctad), told Firstpost.
However, India’s position as the tenth largest FDI recipient in 2014 remains unchanged in 2015 though the FDI amount has increased from $35 billion to $44 billion in 2015.
Greenfield investments in India accounted for the spike in FDI in 2015 while cross-border mergers and acquisitions (M&As) were at a low of $1 billion. The bulk of these greenfield investments were equity investments. Reinvested earnings and intra-company loans were low.
The top 10 sources of equity foreign investment in India were Singapore, Mauritius, the United States, the Netherlands, Japan, Germany, United Kingdom, China, Hong Kong and the United Arab Emirates, said the UN offficial.
“Singapore and Mauritius alone accounted for nearly three-fifths of the total foreign equity investment, reflecting a rise in significant business connections with the former and a degree of round-tripping FDI via the latter,” Dr Zhan said.
Last year saw a sizeable jump in Indian greenfield investment announced in manufacturing, especially in industries such as electrical and electronic equipment ($13.5 billion), metal products ($5.9 billion) and motor vehicles ($3.6 billion).
“The momentum created by the huge increase in announced greenfield investments, including in manufacturing is likely to carry through into realised FDI in 2016 and beyond,” Dr Zhan added.
Globally, 2015 had greenfield investments worth $63 bn surpassing the highest level of investment in 2008 with $62 bn for investment levels in the past decade.
Another Unctad survey called the World Investment Prospects Survey 2016-2018 ranks India third after the United States and China as a prospective FDI host country.
However, outward FDI from India, the dominant investor in South Asia, dropped by more than a third to $7.5 billion — resulting in a drain of 36 percent outflows from South Asia and settling at $8 billion last year.
India was the ninth largest investor in developing Asia.
Between 2010 and 2016 (not including FDI reforms announced on 20 June), India passed 51 new investment policy measures as compared to 24 measures adopted by China during the same period. About 88 per cent of all Indian measures during this period were focused on FDI liberalisation and promotion.
Worldwide, 85 percent of newly adopted investment policy measures in 2015 were addressed towards investment liberalization and promotion. The Unctad World Investment Report 2016 further finds that the remaining 15 percent of new investment measures featuring restrictions or regulations, reflecting concerns mainly about foreign ownership in strategic industries or national security considerations.
The global report card
“A 38 percent jump in flows to $1.76 trillion dollars gives hope that global foreign direct investment is at long last returning to a sustainable growth path; however we are still not out of the woods," Unctad secretary-general Mukhisa Kituyi said.
However, the global rebound in FDI in 2015 was due to a surge in cross-border M&As to the tune of $721 billion, up from $432 billion in 2014. These acquisitions were due to very large corporate reconfigurations by multinational enterprises (MNEs), including shifting their headquarters, for strategic reasons and for tax inversion purposes, the report states.
If these large-scale corporate reconfigurations were discounted from the calculation then global FDI settled at a more moderate increase of about 15 percent last year.
The value of announced greenfield investment remained at a high level of $766 billion.
The US, Hong Kong and China were the top three host countries for FDI. Though China was highest FDI recipient in 2014, it slipped to the third position and exchanged places with the US which was the largest FDI host country in 2015, up from the third-largest in 2014.
China’s outward FDI rose from $123 billion to $128 billion in 2015, as a result of which it held its position as the third largest investor in the world, after the US and Japan.
Last year, FDI inflows to the US almost quadrupled owing mostly to restructuring in the pharmaceutical industries whereas FDI flow to North America reached a high of $429 billion
The year also saw historically high acquisitions globally that raised the share of FDI in manufacturing to more than 50 percent of cross-border M&As in 2015.
Asian investment
Developing Asia remained the largest FDI recipient region in the world with investment flows reaching $541 billion marking a 16 percent increase over the previous year.
In East Asia, the spike was spurred by China while in South East Asia, the increase in investment came from Myanmmar, Vietnam, India and Bangladesh.
FDI inflows to South East Asia as a whole has been consistently rising.
Overall, FDI flows will decrease in 2016 with moderate increase in flows only to India, China, Vietnam and Myanmmar.
Flows to tax havens remains high though marks a decrease from previous years
Though investment flows to offshore financial centres in 2015 continued to roll back from a high of $132 billion in 2013 but remained in line with previous years.
“The magnitude of quarterly flows through Special Protection Entities, in terms of absolute value, rose sharply compared with 2014, reaching the levels last registered in 2012–2013,” the report states.
These flows are excluded from Unctad’s FDI statistics.
Record levels of trade disputes
By 1 January, 2016, there were at least 700 ISDS claims involving a 100 countries from plurilateral trade deals. New investor-State dispute settlement (ISDS) cases amounted to 70 in 2015 – an all-time annual high, the report says.
Advise governments to understand ownership and trade treaties better
The ownership of foreign affiliates is becoming increasingly complex with 40 percent of them worldwide have multiple “passports” involving an average of three jursidictions while 30 percent benefit from mega trade deals through “double passports”.
“Policymakers can strengthen the assessment of ownership chains and ultimate ownership and improve disclosure requirements,” advises the UN.
“However, policymakers should be aware of the administrative burden this can impose on public institutions and on investors. Overall, the report says it is important to find a balance between liberalisation and regulation in pursuing the ultimate objective of promoting investment for sustainable development,” a press statement said.
The report also notes that 80 percent of countries restrict majority foreign ownership in at least one industry.
Indirect ownership structures strengthens the reach of international investment agreements (IIAs).
Up to a third of intra-regional foreign affiliates in major or prospective megaregional treaty deals, such as the Trans-Pacific Partnership (TPP) or the Transatlantic Trade and Investment Partnership (TTIP), are owned by parent companies outside the region, “raising questions about the ultimate beneficiaries of these treaties and negotiations”.
The prospective Regional Comprehensive Economic Partnership deal of which India is a party has the highest percentage of foreign affiliates (among TTIP, TPP and RCEP) with 56 percent direct and ultimate owners outside the region.


 "This Week in Explainers: Will recession in UK, Japan hit daily living?")
 "FirstUp: Nitish Kumar to seek trust vote, RLD to formally join NDA… The big stories today")
 "This Week in Explainers: What Uttarakhand’s Uniform Civil Code means for live-in couples")
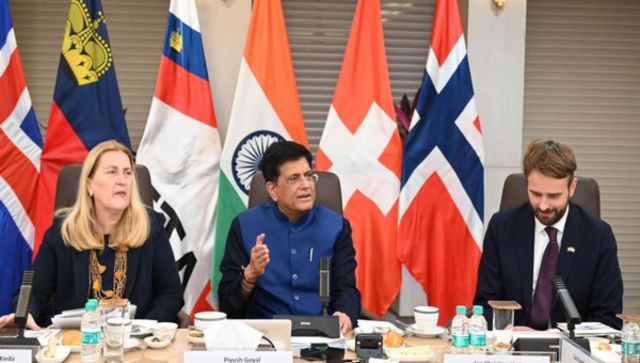 "India-EFTA close to finalise $100 bln trade agreement deal")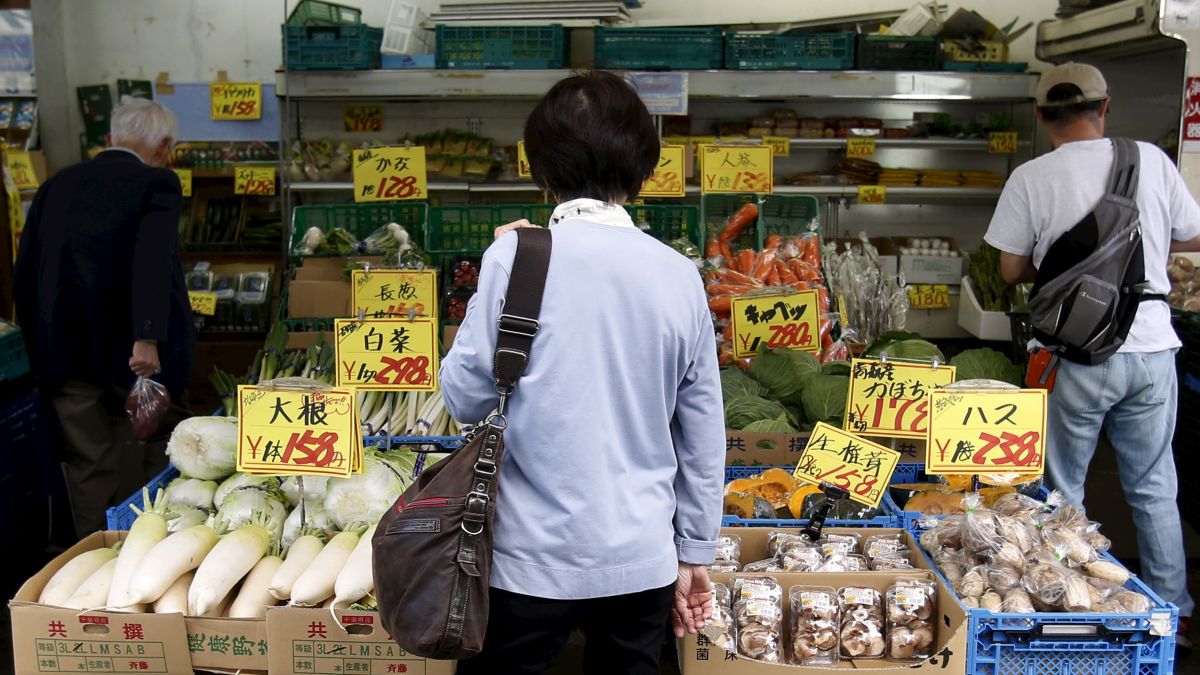