Many construction materials have turned in distressingly weak performances of late.
In forestry products, softwood lumber is -6.8% year over year (y/y); 0.8% quarter to quarter (q/q); and -2.6% month over month (m/m). Hardwood lumber is -9.4% y/y and -0.9% q/q, but 0.8% m/m. Plywood is -7% y/y and -1.1% m/m. Copper wire and cable is -19.1% y/y and -8.1% m/m.
The retreat in China’s ‘real’ (i.e., inflation-adjusted) gross domestic product or GDP growth rate from between 10% to 12% in the mid-00s to a still formidable but significantly reduced 6.9% last year is having a devastating impact on world metal and mineral commodity prices.
And we haven’t even highlighted the really big price drops yet. The collapse in the global price of oil explains why asphalt is -44% y/y; -29.9% q/q; and -8.4% m/m.
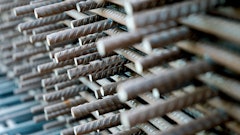
Steel bars, plates and structural shapes are -20% y/y; -9.5% q/q; and -3.4% m/m. Their primary ingredient, iron and steel scrap, is -52% y/y; -29.5% q/q; and -0.6% m/m.
The iron and steel scrap curve stands out for recently dipping all the way back to its previous trough level. The world’s major iron ore producers have been super-aggressive in maintaining production levels, at the expense of posted prices, to weed out the less-efficient mines of their competitors.
The number of materials displaying price increases has been quite limited. Flat glass is 5.6% y/y; 1.2% q/q; and 0.9% m/m. There have been pockets of strong demand, such as for curtain-wall glazing to build new high-rise office and residential towers in the Big Apple, New York.
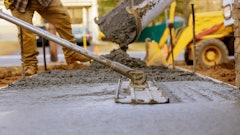
The price of cement, after a small crater in 2011 and 2012, has moved higher and is now 6.7% y/y and 0.3% m/m. Ready-mix concrete, hardly stumbling at all in the fiscal-crisis hard times, has done even better. It is now 3.7% y/y; 1.3% q/q; and 0.4% m/m.
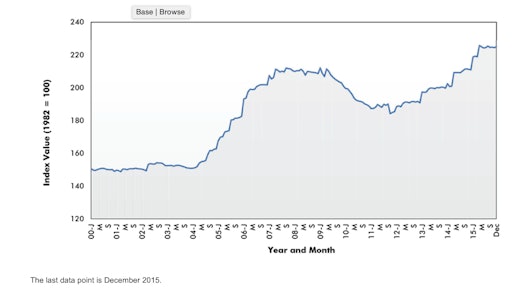
The construction materials price index calculated by the Bureau of Labor Statistics (BLS) is -2.1% y/y. The final-demand costs (i.e., incorporating more than just material inputs) of constructing various types of nonresidential buildings fluctuate mainly in a narrow band around 2%.