Market Overview
Volatility could finally be starting to settle in the markets as we approach the weekend and a tumultuous week draws to a close. This comes after another strong day on Wall Street which has maintained a sense that sentiment is improving once again. The big catalyst for the move was the sharp rebound on oil. The price of WTI and Brent Crude rallied around 10% as they looked to unwind the precipitous falls of the last few weeks. Tis looks to be a rather sizable short squeeze at the moment, but can the move be sustained. A rising or even stable oil price would allow investors to settle their nerves but this may just be a short term phenomena. Although the rebound was helped by the announcement of a better than expected revision to US growth, this is backward looking at Q2. Early next, traders will get the revision of Chinese manufacturing PMIs (and the flash release did not paint a pretty picture last week). This could be a decisive number and if it is disappointing then market could quickly lose this new found confidence. That is for next week though.
Wall Street closed sharply higher again on a volatile session with the S&P 500 up a further 2.4% as the losses from Black Monday have been entirely reversed. Asian markets have also been strong in reaction to further gains on Wall Street, with the Nikkei 225 up 3.0%. However, already there are initial signs of stabilization and the rally settling, as gold has found support overnight and European markets are pensive in early trading.
The signs of stabilisation are also showing through on the Forex markets with a little support showing on the euro and sterling after the sharp losses of the past few days. The yen is slightly weaker after Japanese core CPI came in flat overnight (a 0.2% decline had been expected). The commodity currencies are also stable as the oil price has held on to the gains from yesterday.
Traders will be looking out for the second reading of UK Q2 GDP at 0930BST. The Quarter-on Quarter data is expected to be in line with the first reading of +0.7%. There will also be the German inflation data with the regionals throughout the morning and the national data at 1300BST (which can be a good indication of Eurozone inflation) expected to be in line with last month at +0.2%. The big data of the day though will be the US Personal Consumption Expenditure at 1330BST. This is the Fed’s preferred measure of inflation and the core data is expected to once more be stable at +1.3%. This would not be great for the hawks on the FOMC to persuade any fence-sitters to join their side of the argument.
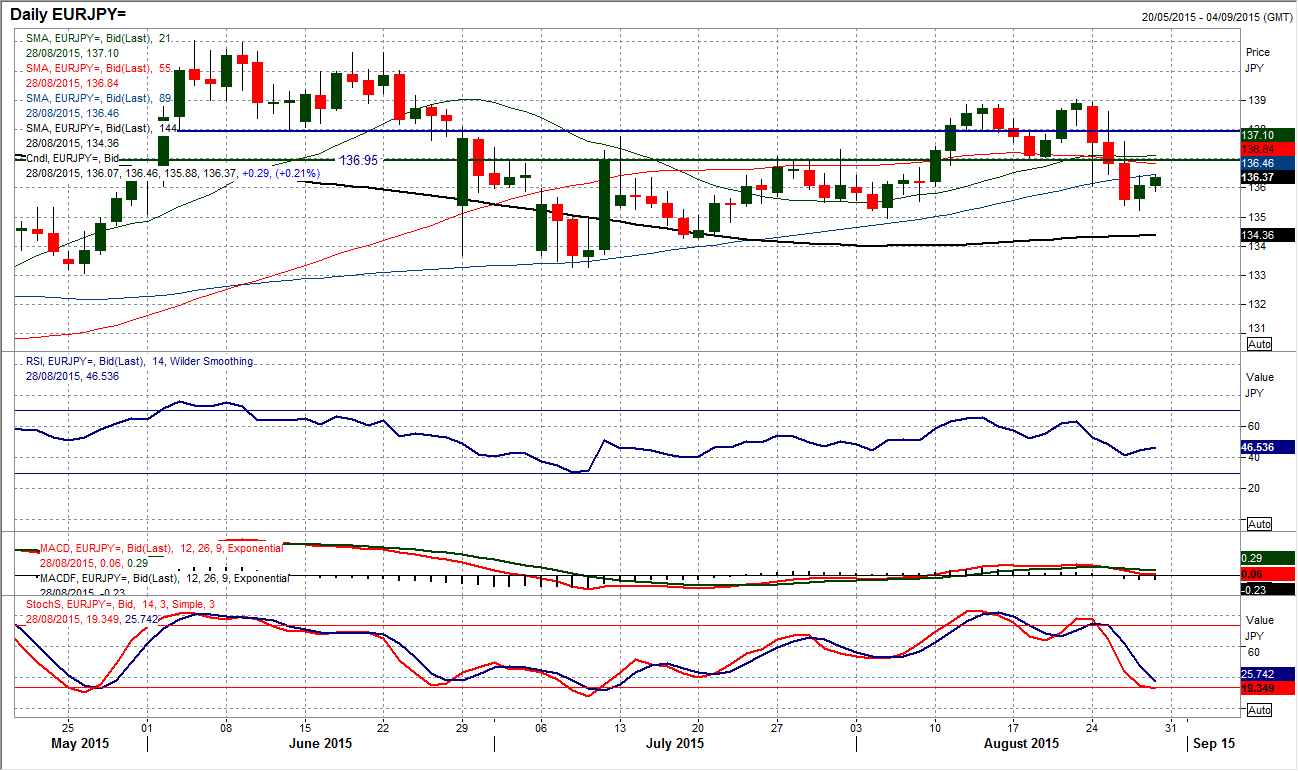
Chart of the Day – EUR/JPY
The sharp correction on Euro/Yen has meant that the bulls are no longer in control The small top pattern that was confirmed by a close below 137 has broken the sequence of higher lows, and the deterioration on the daily momentum indicators reflects this. The RSI is now back below 50, the Stochastics have deteriorated and the MACD lines crossed to turn lower. I do not see this as the beginning of a stronger yen which will drag the pair lower, more that it is reflective of choppy trading conditions on the euro of late, something that could continue for a while. The initial downside target of 135.00 has been all but achieved and the fact that the support has started to set in again suggests that there is more of a neutral outlook now. This is reflected in the hourly chart which now shows consolidation. There is an interesting near term pivot around 136.50 and a move above this level would certainly now improve the near term outlook. Hourly momentum indicators are rather neutrally configured now too. Support is in the band 135.00/135.25.
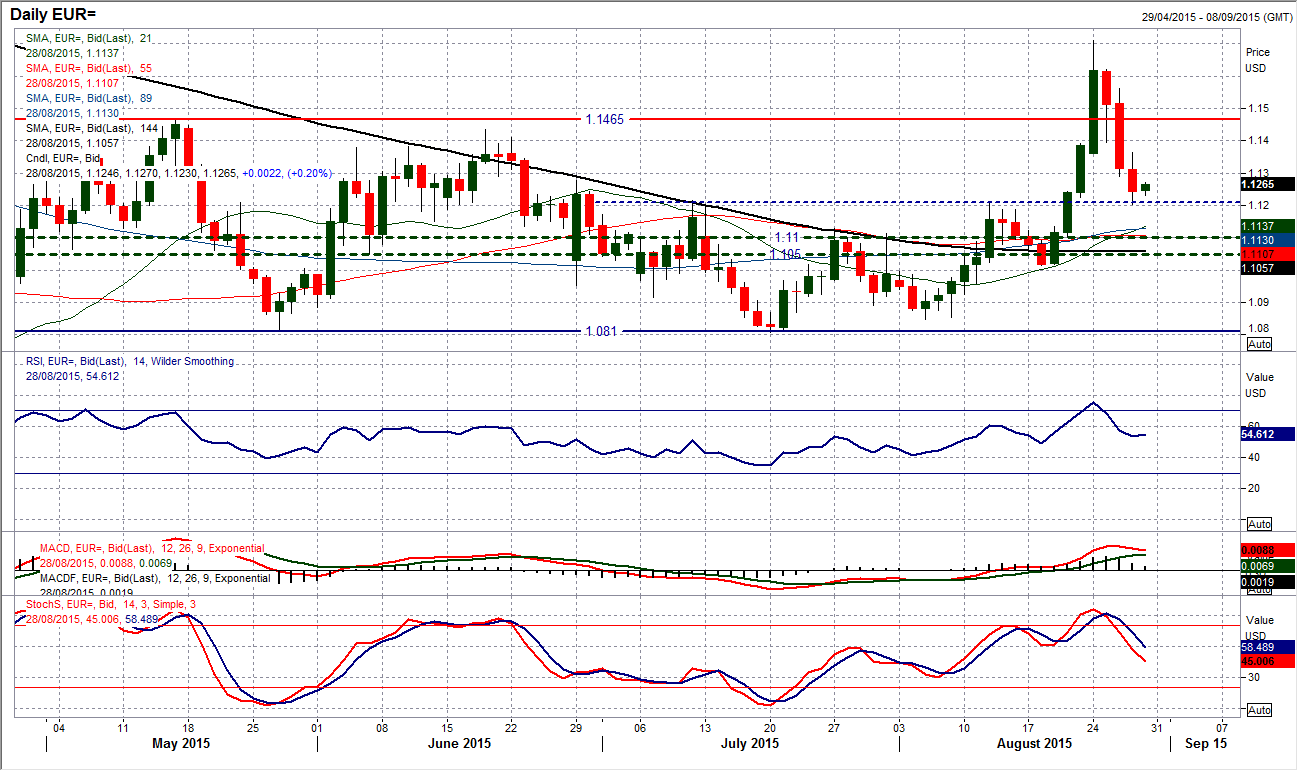
EUR/USD
The sharp reversal completed a third consecutive day of losses yesterday with another strongly bearish candle. The bulls (well at least the more optimistic ones) will point to the fact that the euro closed 40 pips off the low of the day, but already there has been a retracement f 500 pips in the past few days. The incredible volatility now means that we are back into the support band around the old highs at $1.1215. The Stochastics falling away strongly now and with the RSI and MACD lines not quite as corrective I think this all just reflects how the euro is still looking for a settling level where traders can take stock of the situation once more. The support early in the Asian session could be an initial sign of this but looking at the intraday hourly chart which shows the decline over the past few days it suggests that rallies continue to be sold into. Hourly momentum retains a distinctly corrective configuration and a rebound into any resistance is still likely to be sold. The initial resistance is between $1.1290/$1.1307 with further resistance at $1.1264. Further pressure on $1.1200 is likely as the move back towards the old pivot band $1.1050/$1.1100 cannot be ruled out.
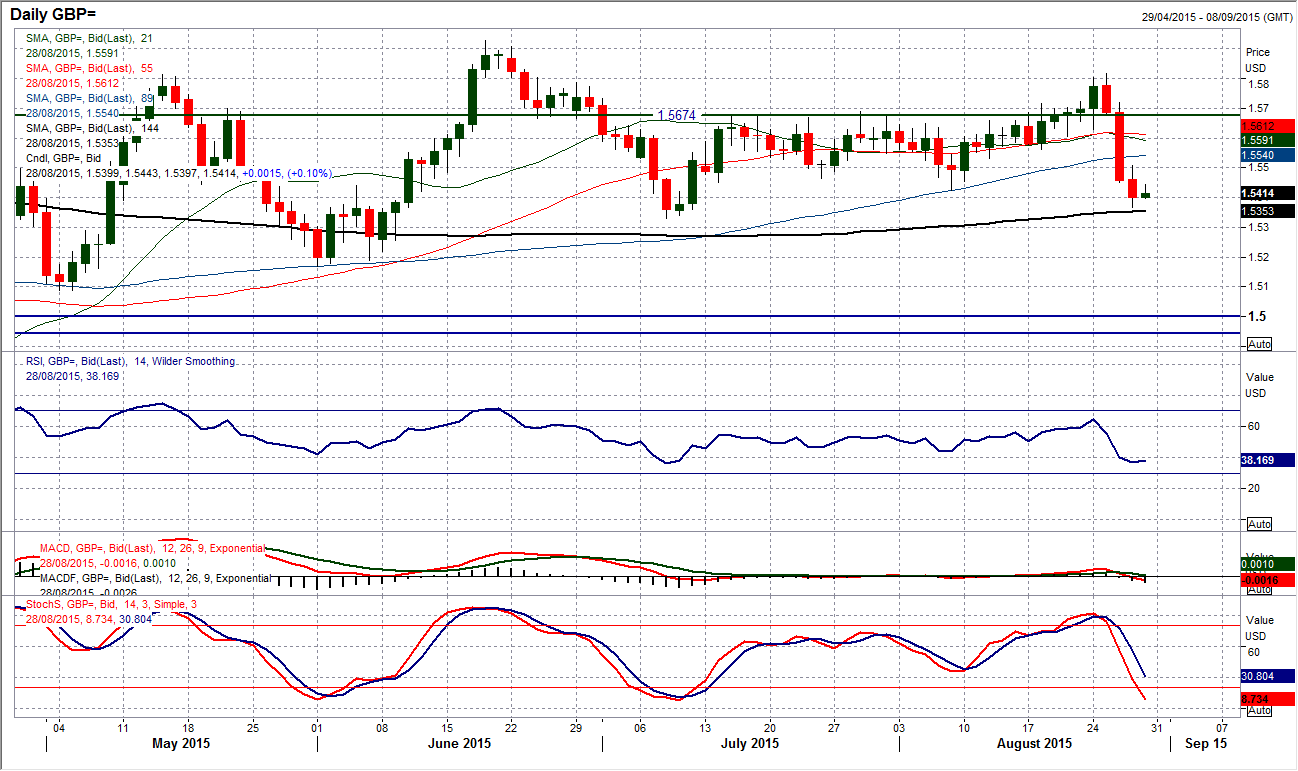
GBP/USD
The corrective forces on Cable continue to drag the price lower. Yesterday’s breach of the support at $1.5422 now opens a move back to the next key low at $1.53328, the key July low. Daily momentum indicators (especially the Stochastics) are corrective and downside pressure is suggesting that rallies are now treated as a chance to sell. There is still a feeling that the market is looking to settle down after the volatility over the past few days but losing the $1.5422 support was important near term. The intraday chart shows a touch of a rebound overnight but I am also concerned that the hourly momentum indicators have been affected by the strength of the decline in recent days and there is a sense that this is just unwinding oversold momentum now. I would expect there to be another lower high under the reaction high at $1.5508 as the bears return for a likely retest of $1.5468. A move above $1.5508 would muddy the waters once more and defer the corrective outlook.
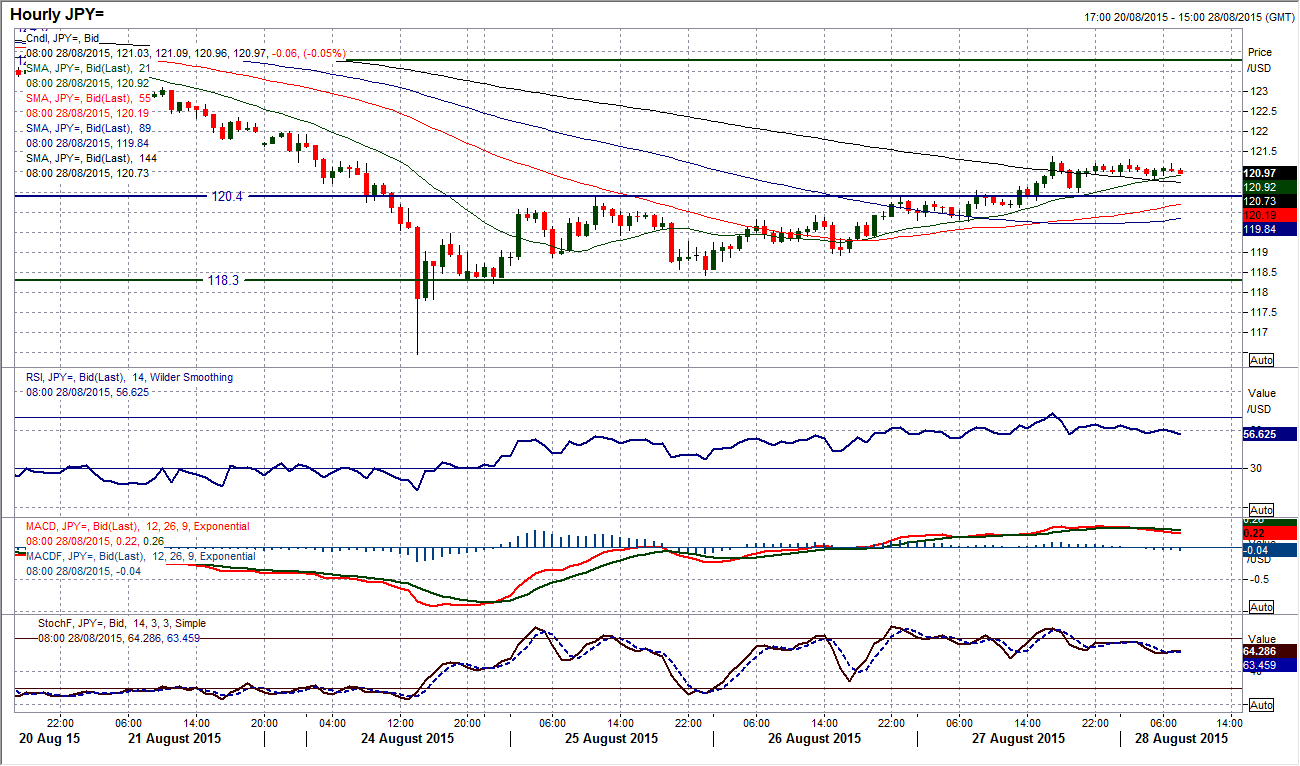
USD/JPY
The rebound in the past few days has been impressive and with another strong day yesterday the pair has now retraced over 50% of the 125.28/116.46 correction. The daily momentum indicators continue to pick up again and the bear pressure continues to unwind. There has been an element of consolidation overnight as the Japanese inflation data has done little to impact on the chart. We therefore come into the European session all but flat on the day. The intraday hourly chart shows a decent recovery in which is built on a series of higher lows using the 21 hour moving average (around 120.85) as a basis of support near term. I spoke yesterday about the 210 pip range that had formed between 118.30/120.40. This saw a break to the upside yesterday with the old breakout resistance coming in to act as new support. The move should now mean a continued recovery (implied target is around 122.50) so the rebound is still on. This suggests using minor corrections as a chance to buy now. A breach of support at 119.90 would defer this outlook.
Gold
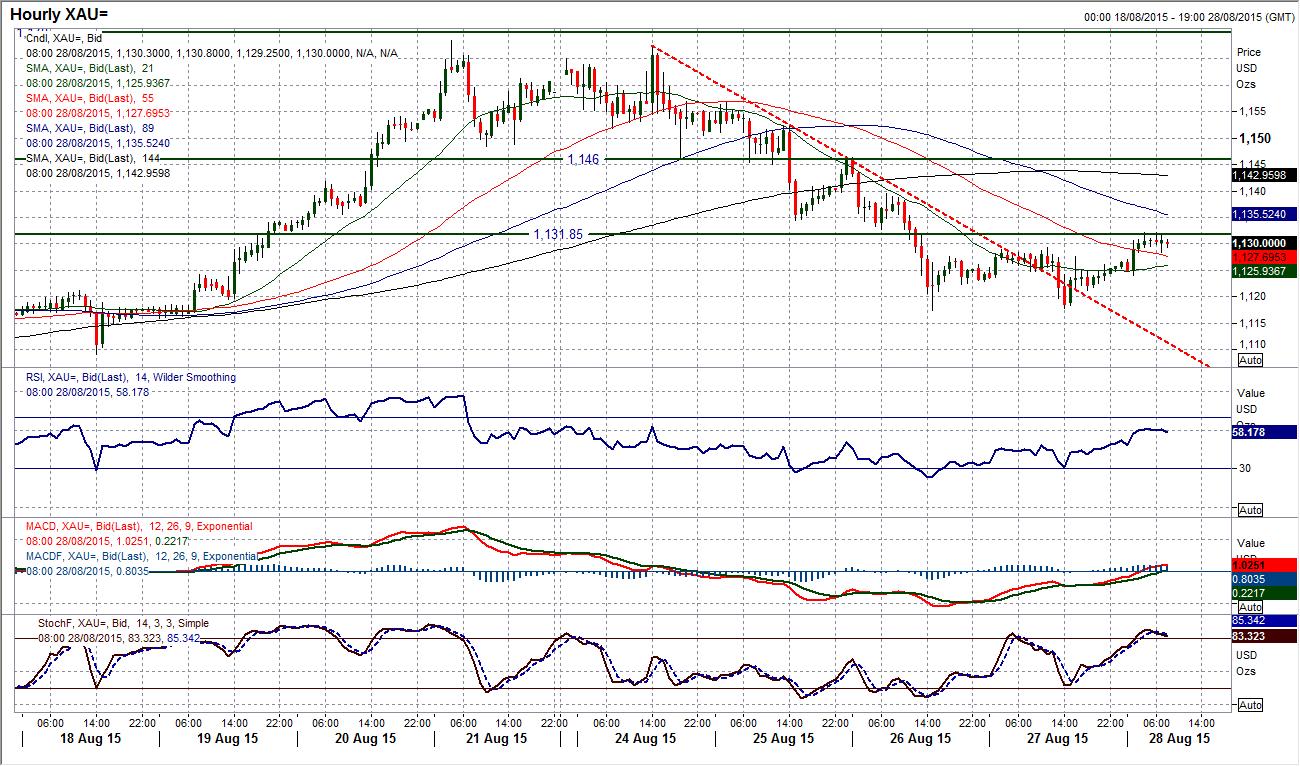
The gold price has finally looked to arrest the decline and has started to consolidate. A “doji” candle on the daily chart suggests uncertainty with the prevailing trend. The fact that this has also come amid a second day of testing and holding the initial support at $1117.40 should also be seen as encouraging. I also notice that despite the Stochastics having been falling away in recent days, the RSI has actually started to settle around the neutral 50 point. The intraday hourly chart shows the near term improvement in much greater detail. The downtrend which has been pulling gold decisively lower has now been broken, whilst the hourly momentum indicators have also improved strongly. If we were to now see the hourly RSI pushing above 70 and the hourly MACD lines consistently above neutral, then the move above $1129.40 could be seen as a completed short term base pattern that would imply a rebound to $1141 (I think the confirmation of these momentum indicators is needed to be confident in this reversal). A break back below the initial support at $1124.00 would abort this base pattern.
WTI Oil
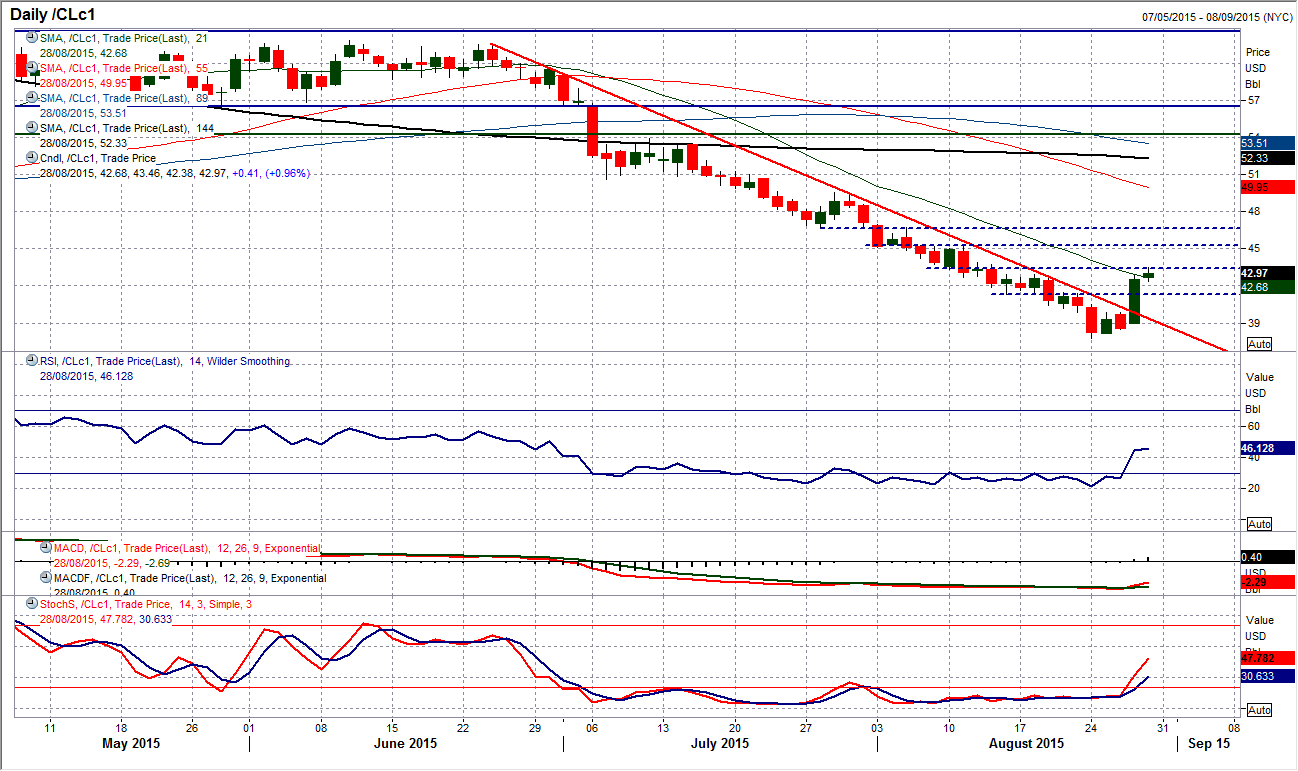
The problem was always going to be that when the oil price stated to rally, it was likely to end up being pretty significant short squeeze. And so we had a huge rally yesterday which has smashed the downtrend. Is this the beginning of recovery? Maybe it is, but it is hard to say how sustainable the rebound is, but a near term low is now in place at $37.75. Looking at the technicals on the daily chart, the RSI is above 40 (which is something I was saying was necessary to suggest a recovery could be taken seriously), whilst the Stochastics have also turned up (no confirmation buy signal quite yet though). The intraday hourly chart shows that having broken above the initial resistance at $40 this level started to acted as support before shooting higher again through the resistance at $41.50 (which now becomes supportive), and now even through $43.00. Today’s trading could be tricky with such a volatile move, it is unlikely to just trade normally and may have further volatility which could result in an unwind. The support band now comes in between $40.50/$41.50. The next key resistance band on the hourly chart comes in around $43.50/$43.90. Once this volatility settles, buying into dips looks a good strategy now, but for now it is likely to be very choppy.
Note: All information on this page is subject to change. The use of this website constitutes acceptance of our user agreement. Please read our privacy policy and legal disclaimer. Opinions expressed at FXstreet.com are those of the individual authors and do not necessarily represent the opinion of FXstreet.com or its management. Risk Disclosure: Trading foreign exchange on margin carries a high level of risk, and may not be suitable for all investors. The high degree of leverage can work against you as well as for you. Before deciding to invest in foreign exchange you should carefully consider your investment objectives, level of experience, and risk appetite. The possibility exists that you could sustain a loss of some or all of your initial investment and therefore you should not invest money that you cannot afford to lose. You should be aware of all the risks associated with foreign exchange trading, and seek advice from an independent financial advisor if you have any doubts.
Recommended Content
Editors’ Picks
EUR/USD edges lower toward 1.0700 post-US PCE

EUR/USD stays under modest bearish pressure but manages to hold above 1.0700 in the American session on Friday. The US Dollar (USD) gathers strength against its rivals after the stronger-than-forecast PCE inflation data, not allowing the pair to gain traction.
GBP/USD retreats to 1.2500 on renewed USD strength

GBP/USD lost its traction and turned negative on the day near 1.2500. Following the stronger-than-expected PCE inflation readings from the US, the USD stays resilient and makes it difficult for the pair to gather recovery momentum.
Gold struggles to hold above $2,350 following US inflation

Gold turned south and declined toward $2,340, erasing a large portion of its daily gains, as the USD benefited from PCE inflation data. The benchmark 10-year US yield, however, stays in negative territory and helps XAU/USD limit its losses.
Bitcoin Weekly Forecast: BTC’s next breakout could propel it to $80,000 Premium

Bitcoin’s recent price consolidation could be nearing its end as technical indicators and on-chain metrics suggest a potential upward breakout. However, this move would not be straightforward and could punish impatient investors.
Week ahead – Hawkish risk as Fed and NFP on tap, Eurozone data eyed too

Fed meets on Wednesday as US inflation stays elevated. Will Friday’s jobs report bring relief or more angst for the markets? Eurozone flash GDP and CPI numbers in focus for the Euro.
