EUR/USD Current price: 1.1079
View Live Chart for the EUR/USD
Monday saw majors seesaw in quite limited ranges, with the American dollar ending the day with some gains across the board. In Europe, the EU Trade Balance for June resulted in a surplus of €26.4B, compared with €16.0 a year before, which helped the EUR/USD pair advance up to 1.1124 intraday. US data resulted disappointing, with the NY manufacturing index tumbling to -14.9, the lowest in six years, against expectations of a 5.0 advance. The calendar will remain light in both economies this Tuesday, with investors focused on US CPI figures and the FOMC latest minutes, to be released next Wednesday.
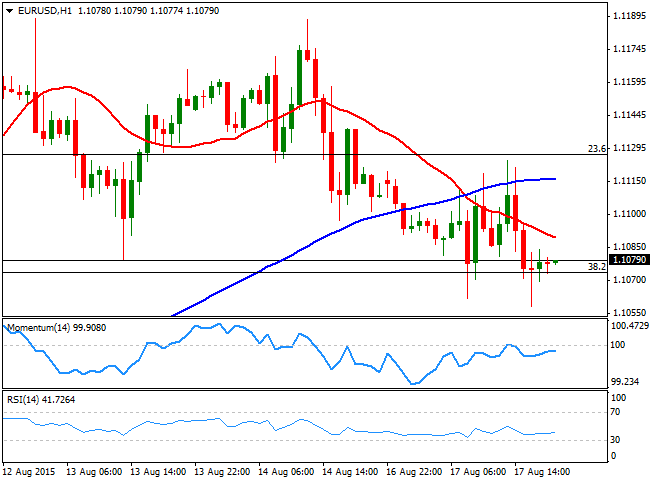
Technically, the pair holds around the 38.2% retracement of its latest bullish run, from 1.0847 to 1.1213 at 1.1075 with a short term negative tone, as in the 1 hour chart, the price was rejected by its 100 SMA and holds now below a bearish 20 SMA, whilst the technical indicators present a tepid bearish tone in negative territory. In the 4 hours chart, the 20 SMA turned south around the 23.6% retracement of the same rally, whilst the technical indicators maintain their bearish slopes in negative territory, supporting the shorter term view. Should the price extend below 1.1060, the downside is open for further declines down to the 1.0980 price zone.
Support levels: 1.1060 1.1020 1.0980
Resistance levels: 1.1130 1.1170 1.1220
EUR/JPY Current Price: 137.75
View Live Chart for the EUR/JPY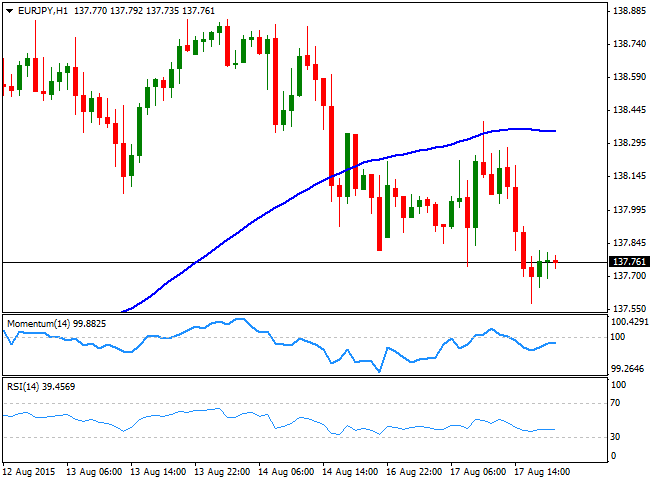
The EUR/JPY is barely unchanged from Friday's close, as despite the pair started the week with a small gap higher, trades now around 137.70/80. There was little action in the forex board this Monday, albeit this particular cross remained flat amid both currencies weakening against the greenback, the EUR correcting from its recent highs, and the JPY hit by Japanese GDP figures. The pair is still holding above its 200 SMA in the weekly chart, still unable to define a longer term trend. In the 1hour chart, the pair remained below its 100 SMA, broken last Friday, whilst the technical indicators head slightly higher, but below their mid-lines, reflecting little buying interest. In the 4 hours chart the technical indicators lack directional strength, but are also in negative territory, increasing the risk towards the downside, on renewed selling interest below the daily low set at 137.57.
Support levels: 137.60 137.20 136.60
Resistance levels: 138.40 138.90 139.50
GBP/USD Current price: 1.5593
View Live Chart for the GPB/USD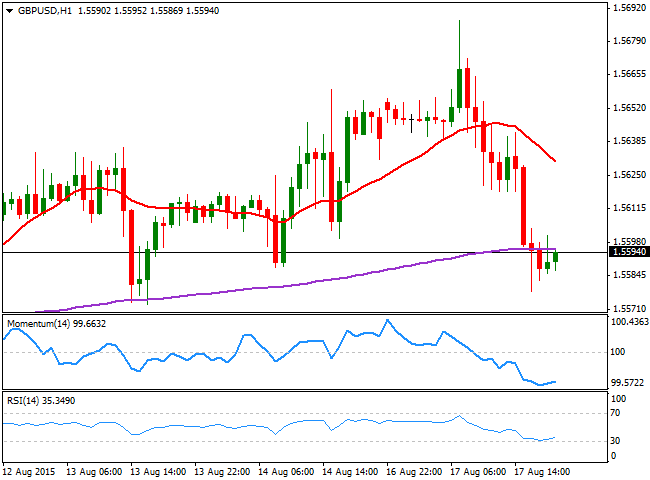
The GBP/USD pair advanced to a fresh 3-week high with the European opening, reaching 1.5687. The Pound got help from Kristen Forbes, one of the MPC voting members, who during the weekend said that the UK may need to raise rates sooner, even before the inflation reaches 2.0%, as keeping rates low may undermine the economic recovery. The pair however, retreated sharply from the level, breaking below the 1.5600 in the American afternoon, where it stays by the close. On Tuesday, the UK will release its CPI and PPI figures for July, which may give some clues on whether the BOE can raise rates as soon as its members suggest. Technically however, the bias is lower, as the 1 hour chart shows that the 20 SMA turned lower well above the current level, whilst the technical indicators hold flat near oversold levels. In the 4 hours chart the price bounced from its 200 EMA, but remains below its 20 SMA whilst the technical indicators hover around their mid-lines, lacking clear directional strength. Strong selling interest has been limiting the upside around 1.5670/80 ever since July started, which means a clear break above it is required to confirm additional advances, quite unlikely for this Tuesday.
Support levels: 1.5615 1.5570 1.5540
Resistance levels: 1.5670 1.5710 1.5750
USD/JPY Current price: 124.41
View Live Chart for the USD/JPY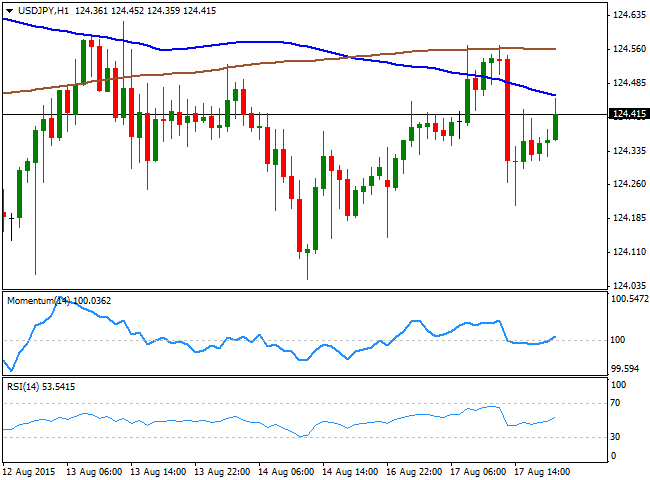
The Yen weakened during the past Asian session, as the Japanese economy contracted in the second quarter, down 1.6%, as consumer and businesses cut spending. The economic slowdown suggests the BOJ may need to add further stimulus to achieve its inflation target of 2.0% by the beginning of 2016, spooking investors. The USD/JPY advanced up to 124.56, although poor US manufacturing data triggered a downward move towards 124.15, from where the pair slowly recovered during the US session. Technically, the 1 hour chart shows that the price stalled around its 200 SMA, currently the immediate resistance around 124.60, whilst the technical indicators aim slightly higher in neutral territory, lacking clear strength at the time being. In the 4 hours chart, the price held above a flat 100 SMA, whilst the technical indicators are also stuck around their mid-lines, giving no clues on what's next for the pair.
Support levels: 124.00 123.70 123.30
Resistance levels: 124.60 124.95 125.40
AUD/USD Current price: 0.7378
View Live Chart for the AUD/USD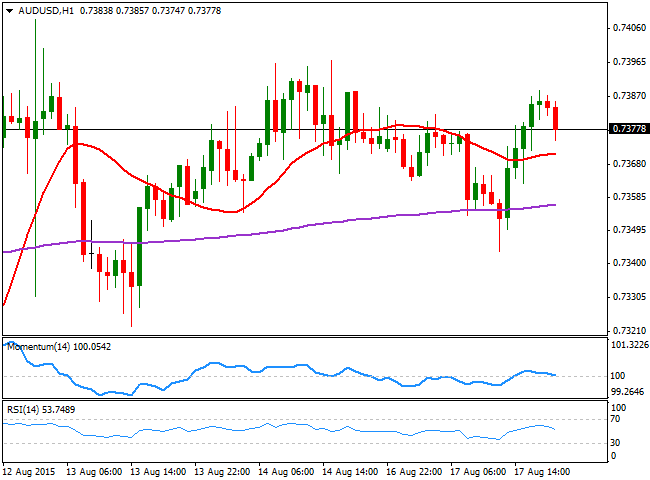
The Australian dollar erased all of its intraday losses against the greenback, with the AUD/USD finding some intraday demand after bottoming at 0.7343 early in the American morning. The pair is unchanged daily basis, and maintains a neutral tone, albeit compared with Friday's one, the daily candle shows a lower high and a lower low, increasing the risk of a break lower. The short term technical picture is neutral, as the 1 hour chart shows that the price moves back and forth around an horizontal 20 SMA, whilst the technical indicators also lack directional strength, laying flat around their mid-lines. In the 4 hours chart, the price managed to recover above its 20 SMA in the last hours, but the indicator has lost its bullish slope, whilst the Momentum indicator heads lower, approaching the 100 level, and the RSI stands flat around 54. Chances of a stronger decline will surge on a break below 0.7295, with scope then to retest the recent multi-years lows near the 0.7200 level.
Support levels: 0.7335 0.7295 0.7250
Resistance levels: 0.7410 0.7450 0.7490
Recommended Content
Editors’ Picks
EUR/USD holds above 1.0650 after US data

EUR/USD retreats from session highs but manages to hold above 1.0650 in the early American session. Upbeat macroeconomic data releases from the US helps the US Dollar find a foothold and limits the pair's upside.
GBP/USD retreats toward 1.2450 on modest USD rebound

GBP/USD edges lower in the second half of the day and trades at around 1.2450. Better-than-expected Jobless Claims and Philadelphia Fed Manufacturing Index data from the US provides a support to the USD and forces the pair to stay on the back foot.
Gold clings to strong daily gains above $2,380

Gold trades in positive territory above $2,380 on Thursday. Although the benchmark 10-year US Treasury bond yield holds steady following upbeat US data, XAU/USD continues to stretch higher on growing fears over a deepening conflict in the Middle East.
Ripple faces significant correction as former SEC litigator says lawsuit could make it to Supreme Court

Ripple (XRP) price hovers below the key $0.50 level on Thursday after failing at another attempt to break and close above the resistance for the fourth day in a row.
Have we seen the extent of the Fed rate repricing?

Markets have been mostly consolidating recent moves into Thursday. We’ve seen some profit taking on Dollar longs and renewed demand for US equities into the dip. Whether or not this holds up is a completely different story.