This post was written by a developer who works on the Zend Server project. We’re pretty keen on editorial independence here at SitePoint, but occasionally we feature articles from people working directly on some of our favorite tools.
Necessity is the mother of invention goes the famous saying.
For PHP developers, there is no greater need than visibility. But developers today have a tough choice to make as they develop and debug their apps. Either use crude methods such as printing, debugging information, or storing it in a log file, or – use multiple debugging/profiling tools that are awkward and require a lot of work from the developer’s side.
Either way – this means time. Time spent accessing the PHP log. Time spent accessing SQL queries. Time spent finding that one bad function or PHP error causing a bottleneck or crashing your app.
This article introduces the top 10 features of Z-Ray – an innovative new technology from Zend that makes PHP development a whole lot quicker and easier by giving developers unprecedented insight into their code – and the visibility they need to develop top-notch apps.
About Zend Server
Zend Server is an integrated application platform for mobile and web PHP apps. It includes an advanced and secure PHP stack (which is fully compatible with php.net’s PHP and based on the same source code), with over 80 popular PHP extensions and libraries.
Zend Server includes tools that help you develop, debug, deploy and monitor your PHP apps, together with advanced features for optimizing performance, scalability and reliability.
Zend Server supports Apache, NGINX and IIS Web servers, and is delivered as native packages for all leading Linux distributions, Windows, MAC OS X and IBM i environments, including Cloud environments such as AWS.
Zend Server supports any PHP code, and provides deep insight into that code, including popular PHP applications and frameworks like WordPress, Magento, Drupal, Zend Framework, Symfony, and Laravel.
See this overview for more information on what Zend Server is and how to install it.
What’s Z-Ray?
Z-Ray is a Zend Server component that monitors requests made to the Web server, and then displays all the details of a page request, across all the PHP scripts involved in building the page, in a nifty toolbar at the bottom of your browser.

Z-Ray is injected into the response coming from your PHP app and shown right in front of you, in your browser. You do not have to tweak your code or change your development workflow at all – simply open your app in a browser or even on a mobile device.
Z-Ray is designed to be non-intrusive – it’s small enough to be ignored if you don’t care about the diagnostics of the page. But if you do, it’s right there at your fingertips – full of data about the page that was just rendered – without having to explicitly run any additional tool or recreate the request. Z-Ray will also attempt to catch your attention if it has something important to tell you by displaying a red flag icon, if a critical error or event has occurred.
Z-Ray’s Top-10
The remainder of the article will outline Z-Ray’s top 10 features. At the end of the article, you’ll find useful links you can check out to learn about additional Z-Ray features. Let’s start the countdown!
10. Page Requests
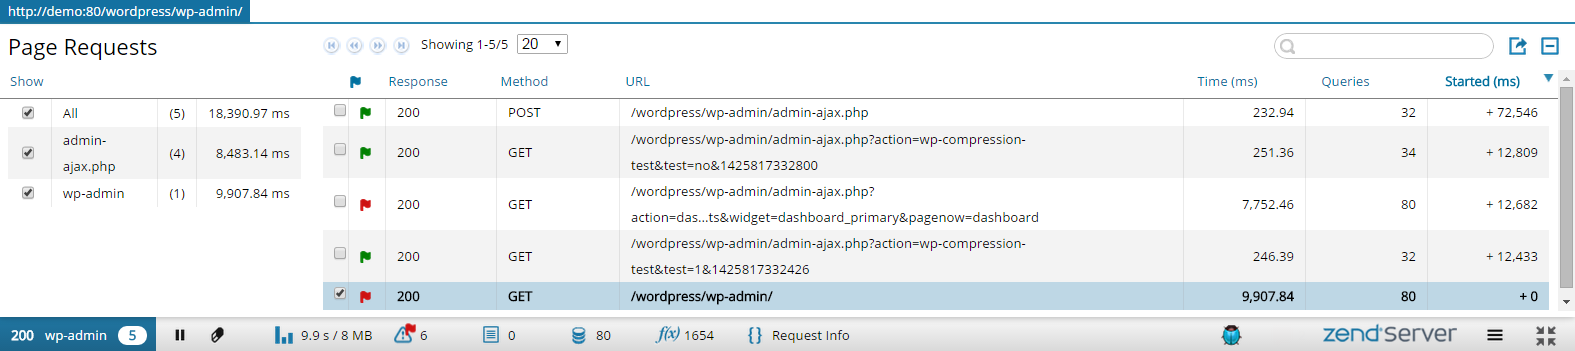
The Page Requests panel in Z-Ray lists all the requests sent from your page to the Web server, with information on their response, method, path, the time they took, and the amount of executed DB queries. If an error occurred during execution, you’ll know about it because of a colored flag that appears beside the request.
In case of multiple requests such as ajax calls, you can drill down into a specific sub-request by selecting it from the requests list. Z-Ray is then filtered accordingly and displays data for that request only.
9. Execution Time and Memory Consumption
Not sure how much server time is being wasted processing database queries? The Execution Time and Memory Peak panel in Z-Ray is a great way to get a general idea of how your server resources were consumed by the request. It displays the peak memory usage and gives you a breakdown (PHP, Database, IO, Network) of the request to help you understand how it was processed by the web server.

8. Monitor Events
The Z-Ray Monitor Events panel gives you a list of any Zend Server “monitoring events” that may have been triggered by the request, alerting you of PHP errors, high memory usage, slow request execution, and more, as defined by your monitoring rules in Zend Server. More about Zend Server Monitoring…
You can see the full details on the event in the Zend Server UI – just click the corresponding icon for the event. If a code trace was triggered for the event, it can be accessed directly from Z-Ray as well. More about Zend Server Code Tracing…

7. Errors and Warnings
Accessing PHP logs is not a very popular debugging method. It’s awkward and can be time consuming. The Errors and Warnings panel in Z-Ray saves you the bother by displaying uncaught exceptions, errors generated by PHP itself, or those created by its core functions. You’ll be able to see when the error was created, its type, and the actual error message.
A neat feature in this panel is the ability to see entries for expressions silenced by the @ operator. To see these entries, all you have to do is select the ‘@Silenced’ check-box in the filtering area on the left.
Clicking the Backtrace icon on the right displays a complete backtrace of the error, giving you the larger picture of what went wrong.

6. Request Info
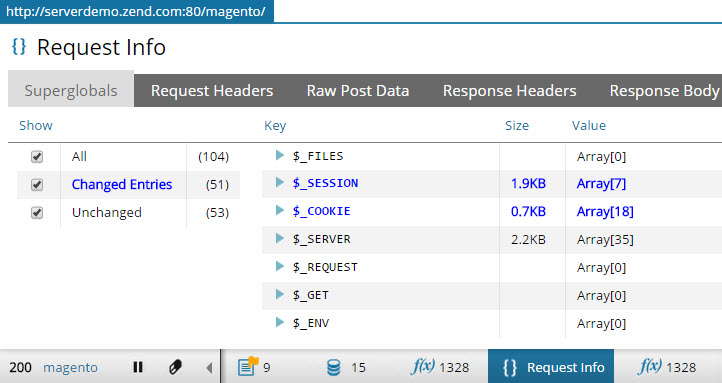
In the Z-Ray Request Info panel, you’ll get a wide array of information about the request.
Firstly, you’ll get a list of the PHP superglobals used in your code. So, for instance, you’ll be able to easily identify if values for your SESSION or COOKIE superglobals changed, and how, including the actual size of the variable.
In addition, you’ll be able to see the request headers, raw post data – if available, and response headers and body.
5. Z-Ray in Production
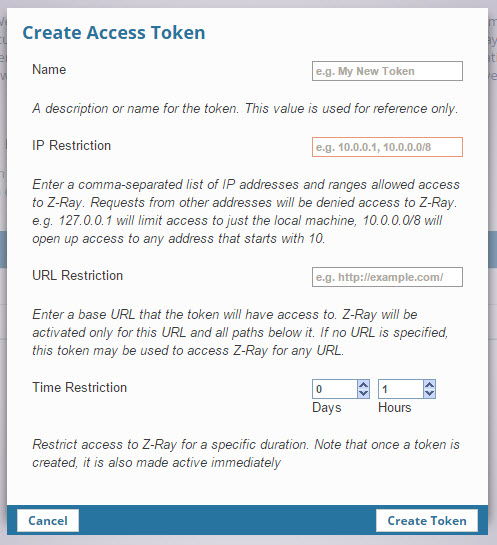
Z-Ray allows developers to analyze code and identify errors early on in the development cycle and way before going into production. However, Z-Ray can be safely used in production as well using access tokens passed as GET parameters in the application’s URL.
Access tokens are easily managed and created using the Zend Server user interface, and can be limited per IP address, per URL, and for a specific time period.
4. Functions
Applications can call hundreds and thousands of PHP functions during execution. Getting visibility into slow or bad-performing functions can be crucial in analyzing performance.
In the Z-Ray Functions panel, you’ll be able to see all the PHP functions called during the request; their name, how many times they were called, the time spent in the scope of the functions, including and excluding time spent in children functions, and more.
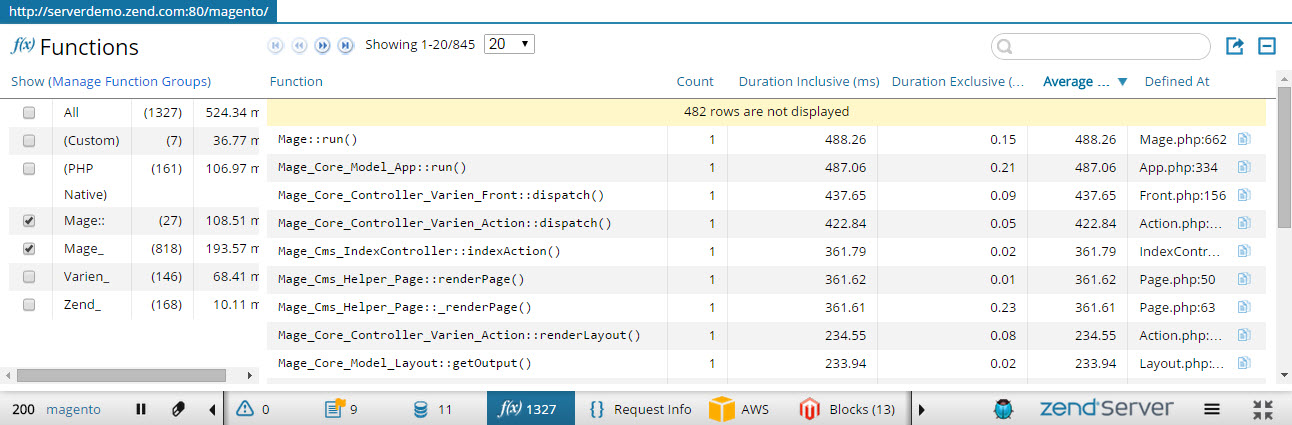
Functions can be filtered according to function groups and namespaces using default filters. You can also create your own function filters. See how here. Additionally, like in the other panels in Z-Ray, the information can be sorted according to a column title so it’s very easy to quickly identify slow functions for example.
To make profiling and sharing with colleagues easier, there is an export button in the corner for generating an HTML-based report.
3. App/Framework Support and Extensibility
One of the niftiest features in Z-Ray is the ability to extend it.
Using extension APIs, (available on GitHub) you can plug in your very own Z-Ray extension, or – customize existing extensions. So no matter what application you’re developing, or what platform/framework you’re using – you can ask Z-Ray to track and display information you think would optimize your development workflow.
In fact, this capability was used to equip Z-Ray with built-in support for popular PHP applications and frameworks such as WordPress, Magento, Drupal, ZF1, ZF2, Symfony, Laravel, and more. This means that if you’re developing one of these apps/frameworks, Z-Ray will automatically display additional panels with app/framework-specific information.

All this works out of the box, without any extra configuration on your part. Simply open the app in a browser.
The process of developing a Z-Ray extension is extremely simple and can boil down to just a few lines of code. Check out this tutorial to learn just how simple it is.
Z-Ray’s eco-system is growing on a weekly basis, with more and more extensions contributed by the PHP community, including extensions for Joomla, OPcache, Doctrine2, Redis, OroCRM, and more.
2. Debugging Mobile and APIs
All of the above described information is displayed by Z-Ray for an application open in a browser. But what about mobile applications? What if you’re developing APIs and Web services?
Non-browser based requests are displayed on Z-Ray Live! – a dedicated page inside the Zend Server user interface. While in development, and from the moment this page is loaded, Z-Ray will record and display any request made to the web server, regardless of its origin – a browser, a mobile device or a web-service client. All the information displayed for an app open in a browser is displayed here as well – no exception.
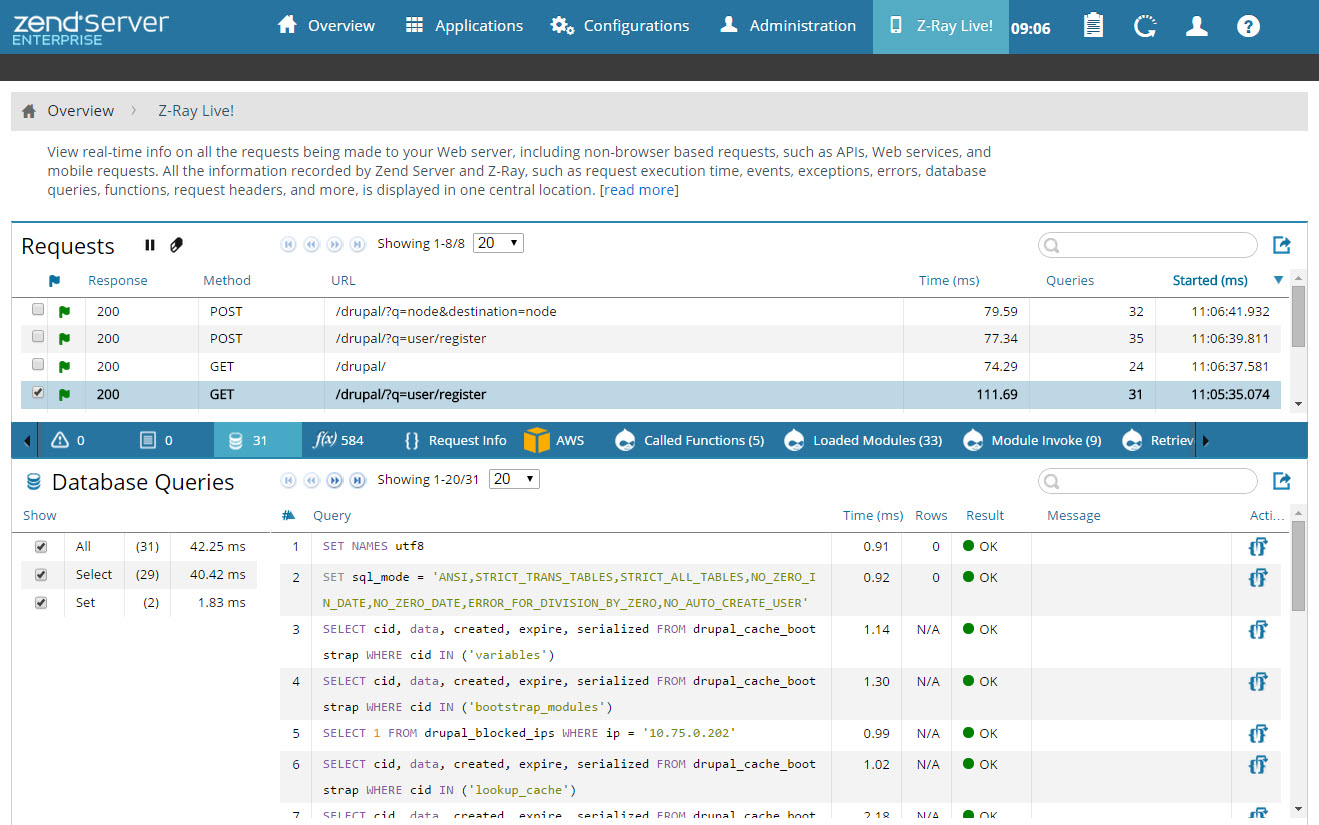
Take a closer look at just how easy this is in this video – Developing Mobile Apps and APIs with Z-Ray Live!
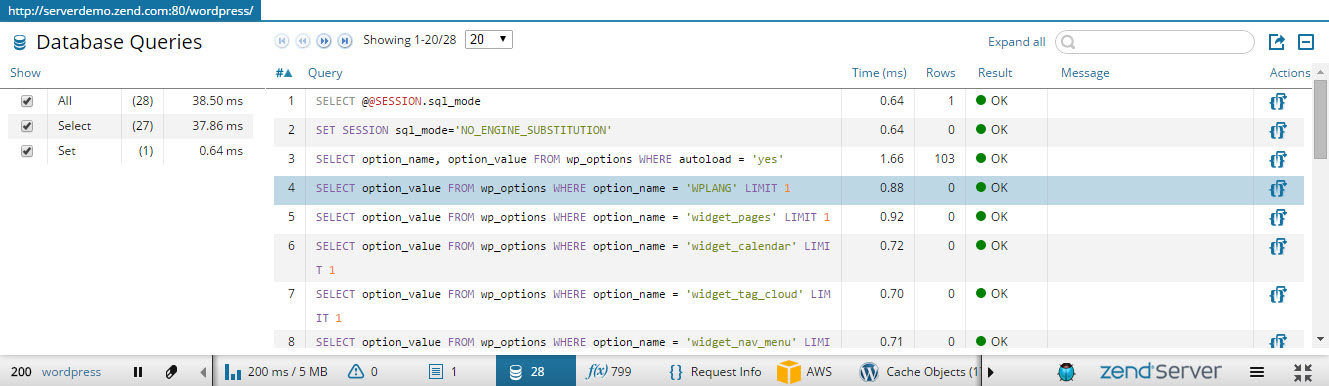
1. Database Queries
Database Queries is one of the features in Z-Ray that PHP developers are most hyped about and that’s why I listed it in 1st place. In a way, this panel symbolizes what Z-Ray is all about – giving you critical information about your app that was previously very hard and time-consuming to get your hands on.
The Database Queries panel beautifully outlines all the SQL queries executed by the request, displaying priceless information about each query – such as a query’s bound value, it’s result, how long it took and the number of affected rows.
Even though getting a list of the queries your page has executed is typically extremely important during development and debugging, the reality is that without Z-Ray – it’s often not easy or practical to obtain. Developers who develop against a company database may not have access to the database query log due to security considerations. Some databases (such as SQLite) don’t even have a query log to begin with. And even if you do have access to the query log, extracting the queries that were run specifically from the page you’re looking into may not be easy, as the query log contains a mix of all of the queries from all of the different pages, potentially also from other developers working with that database at the same time. Z-Ray’s in-context query list is therefore a lot more powerful, and at the same time very easy to use.
To get the larger picture on how your code was executed, you can also produce a fully detailed, and printable, backtrace for a query. This is especially useful if you use a database abstraction layer – where determining where the query came from may not be possible from just looking at the filename and line number where it was invoked.
Useful Links
Here are some additional information sources that you will find useful:
* Live demos: WordPress | Drupal | Magento | ZF2 | Laravel
* Z-Ray videos
* Z-Ray Extension API
* Zend.com
Feedback
As Z-Ray is an ongoing project, you can send your comments or ideas using one of the following channels:
zs-feedback@zend.com | daniel.be@zend.com | @proudboffin
To learn about how to write your own Z-Ray extension, see this tutorial.
 Daniel Berman
Product Evangelist at Logz.io. Author and blogger. Write about PHP, ELK, Log Analytics and BigData. Family man, runner and Liverpool FC fan.