Association between randomised trial evidence and global burden of disease: cross sectional study (Epidemiological Study of Randomized Trials—ESORT)
BMJ 2015; 350 doi: https://doi.org/10.1136/bmj.h117 (Published 28 January 2015) Cite this as: BMJ 2015;350:h117
- Connor A Emdin, doctoral student1,
- Ayodele Odutayo, doctoral student23,
- Allan J Hsiao, masters student4,
- Mubeen Shakir, masters student4,
- Sally Hopewell, senior research fellow25,
- Kazem Rahimi, associate professor1,
- Douglas G Altman, director2
- 1George Institute for Global Health, University of Oxford, Oxford OX1 3DB, UK
- 2Centre for Statistics in Medicine, Nuffield Department of Orthopaedics, Rheumatology and Musculoskeletal Sciences, University of Oxford, Oxford, UKJ
- 3Faculty of Medicine, University of Toronto, Toronto, ON, Canada
- 4University of Oxford, Oxford, UK
- 5Centre d’Epidémiologie Clinique, Université Paris Descartes, INSERM U1153, France
- Correspondence to: C Emdin cemdin{at}georgeinstitute.org.uk
- Accepted 6 December 2014
Abstract
Objectives To determine whether an association exists between the number of published randomised controlled trials and the global burden of disease, whether certain diseases are under-investigated relative to their burden, and whether the relation between the output of randomised trials and global burden of disease can be explained by the relative disease burden in high and low income regions.
Design Cross sectional investigation.
Study sample All primary reports of randomised trials published in December 2012 and indexed in PubMed by 17 November 2013.
Main outcome measures Number of trials conducted and number of participants randomised for each of 239 different diseases or injuries; variation in each outcome explainable by total disability adjusted life years (a measure of the overall burden of each disease) and the ratio of disability adjusted life years in low income to high income regions (a measure of whether a disease is more likely to affect people living in high income regions) quantified using multivariable regression.
Results 4190 abstracts were reviewed and 1351 primary randomised trials identified, of which 1097 could be classified using the global burden of disease taxonomy. Total disability adjusted life years was poorly associated with number of randomised trials and number of participants randomised in univariable analysis (Spearman’s r=0.35 and 0.33, respectively), although it was a significant predictor in the univariable and multivariable models (P<0.001). Diseases for which the burden was predominantly located in low income regions had sevenfold fewer trials per million disability adjusted life years than diseases predominantly located in high income regions. However, only 26% of the variation in number of trials among diseases could be explained by total disability adjusted life years and the ratio of disability adjusted life years in low income regions to high income regions. Many high income type diseases (for example, neck pain, glomerulonephritis) have proportionally fewer randomised trials compared with low income type diseases (for example, vitamin A deficiency).
Conclusions Overall, a weak association existed between global burden of disease and number of published randomised trials. A global observatory for research is needed to monitor and reduce the discordance between the output of randomised trials and global burden of disease.
Introduction
Randomised controlled trials form the cornerstone of evidence based medicine and are the gold standard for the evaluation of healthcare interventions.1 Imbalances between the burden of disease, as estimated by the Global Burden of Disease Study, and the output of randomised trials might indicate that certain diseases are under-investigated relative to their attributable morbidity and mortality. To monitor global research trends, the World Health Organization is studying the feasibility of establishing a global observatory for research.2 Determining whether significant inequity between diseases exists in randomised trial evidence may provide guidance to policy makers on whether to invest the limited resources available for such an observatory into the evaluation and monitoring of randomised trial evidence. Additionally, characterisation of inequity in randomised trial evidence (for example, whether inequity is largely explained by a lack of trial evidence for diseases predominantly affecting people in low income regions) may inform priority setting decisions on which research areas or diseases are most important to monitor. Availability of comprehensive and contemporary evidence on the relation between randomised trial evidence and global burden of disease is therefore critical to guide this effort.
To date, studies on the relation between global burden of disease and output of randomised trials have been either qualitative or limited to subgroups of clinical trials.3 For instance, a recent analysis examined the relation between burden of disease in sub-Saharan Africa and randomised trials conducted in the region, and the authors concluded that the number of trials was moderately correlated with disease burden (r=0.53).4 The quantity of published systematic reviews by disease category has also been shown to be moderately correlated with global burden of disease (r=0.54).5 Finally, previous analyses of whether randomised trial evidence is proportional to global burden of disease have been restricted to randomised trials examining the leading sources of global burden of disease, published in leading medical journals,3 or randomised trials within trial registries,2 and have not compared a representative sample of studies among geographical regions.
Accordingly, this study sought to fill this gap and provide a contemporary and comprehensive examination of whether the global output of randomised controlled trials is associated with global burden of disease. Using the Global Burden of Disease Study 2010,6 we investigated the association between randomised trial evidence and burden of disease at a global and regional level and assessed whether variation in the quantity of randomised trials was associated with burden of disease in high and low income regions.
Methods
Sample selection
We considered all randomised trials published in PubMed in December 2012 and indexed by 17 November 2013. We used an extended version of the Cochrane highly sensitive search strategy to identify reports of randomised trials.7 We defined a randomised controlled trial as a clinical study that compared one health intervention with another in human participants who were randomly allocated to study groups. We included only the primary publications of randomised trials, defined as the publication that reports the results of the primary outcome. When multiple randomised trials were reported in a single publication, we included them as separate studies.
Two authors (CE and AO) independently reviewed abstracts and excluded those that were clearly not randomised trials. Full text publications of remaining abstracts were retrieved, and the same two authors independently reviewed and extracted outcomes (listed below) from each. Differences in eligibility and extraction were resolved by referral to a third researcher (SH). No language restrictions were applied. Data from non-English language studies—namely, those in Chinese, Japanese, Korean, Spanish, German and French—were extracted by AH, who has experience in translating epidemiological studies from the aforementioned languages to English. We obtained translation support for studies in the remaining languages.
Data extraction
From each trial, we extracted the location in which the trial was conducted, the disease the trial focused on, the sample size of the trial, and the methodological design of the trial. As a measure of burden of disease, we assigned global and regional disability adjusted life years to each of 241 categories of disease or injury by using the global burden of disease taxonomy in line with the 2010 Global Burden of Disease Study.6 Each identified randomised trial was assigned to one of the 241 categories of disease or was excluded from the analysis if unclassifiable. We did not assign the sample size of cluster randomised trials (32 trials, 2.4% of sample) to diseases, as we viewed the trials as having abnormally large sample sizes that could potentially result in spurious associations. However, we included these trials in the analysis of number of trials per disease, our primary analysis.
Published randomised trials did not consistently distinguish between ischaemic strokes and haemorrhagic strokes, defined as separate diseases in the global burden of disease taxonomy. Consequently, we combined both diseases in a single category defined as “stroke” in our analysis. We excluded yellow fever from the analysis, as the number of disability adjusted life years assigned to the disease under the global burden of disease taxonomy was unreliable. Thus, 239 diseases were used in the analysis.
For each disease, we determined disability adjusted life years found in high income, middle income, and low income regions by using the global burden of disease taxonomy and World Bank 2013 income classification.8 We defined high income regions as Australasia, high income North America, high income Asia Pacific, and western Europe. Middle income regions were Oceania, the Caribbean, east Asia, central Asia, eastern Europe, central Europe, tropical Latin America, southern Latin America, central Latin America, north Africa, and the Middle East. Low income regions were western sub-Saharan Africa, southern sub-Saharan Africa, eastern sub-Saharan Africa, central sub-Saharan Africa, and south Asia. We classified these regions as high, middle, or low income regions on the basis of whether most of their population resided in high, middle, or low income countries, again classified using World Bank gross domestic product per capita criteria for 2013.8
To determine whether the relation of number of randomised trials conducted to burden of disease differed by the location of the trial, we also determined the country in which each trial was conducted. We defined a trial as being conducted in a country if it recruited most participants from that country. We used the manuscripts of each study and trial registries, if available, to determine this information. Countries were classified in one of the 10 different regional groupings defined by the Global Burden of Disease Study: Latin America, sub-Saharan Africa, Caribbean and Oceania, central and eastern Europe, north Africa and the Middle East, central Asia and east Asia, south and southeast Asia, high income (western) Europe, high income North America, or high income Asia and Australasia.6
Outcomes and statistical analysis
As a measure of quantity of randomised trial evidence, we used two outcomes: the number of randomised trials and the total number of participants randomised. We assessed normality by using histograms and with overlying normality and kernel density plots. Owing to the non-normal distribution of the data, we calculated Spearman’s correlation coefficients for the relation between randomised evidence (both number of trials and number of participants randomised) and total disability adjusted life years. We also assigned each disease a ratio, representing the proportion of disability adjusted life years in low income regions to high income regions, as has been previously done in the literature.2 This ratio acts as a measurement for how much a disease predominantly affects people living in low income regions relative to those living in high income regions. For trials that had no disability adjusted life years in high income regions, we assigned the maximum value of ratio observed (194 761). We then used multivariable regression to examine the relation between log transformed number of randomised trials (dependent variable, transformed owing to positive skew) and log transformed total disability adjusted life years (global disability adjusted life years) and log transformed ratio of disability adjusted life years in low income regions to high income regions (independent variables). Before logarithmic transformation, we added one trial and one participant to all diseases, to allow for inclusion of diseases with no trials in the log transformed regression analysis. We did a sensitivity analysis with the exclusion of these trials and no addition of one trial and participant. We also classified diseases into four equal groups by their ratio, with the first category containing high income type diseases, defined as diseases with the highest relative burden of disease in high income regions and lowest relative burden of disease in low income regions (for example, Alzheimer’s disease) and the fourth category (low income type) representing diseases found predominantly in low income regions (such as schistosomiasis). We calculated the number of trials per million disability adjusted life years for each category of diseases.
To examine variation among high income, high equal, low equal, and low income type diseases (that is, the four quarters of diseases ranked on the basis of the ratio of disability adjusted life years in high income regions to low income regions), we further split diseases within each category into four quarters by trials per million disability adjusted life years. For example, we divided high income type diseases (60 diseases in total) into four quarters of 15 diseases, with the first quarter containing the 15 diseases with the highest number of trials per million disability adjusted life years and the bottom quarter containing the 15 diseases with the lowest number of trials per million disability adjusted life years. We examined the variation among trials per million disability adjusted life years within disease-income categories.
We calculated the number of trials per million people and the number of randomised participants per million people for each of the 10 regions and assessed regional variation in the output of randomised trials. We also calculated the number of trials and number of randomised participants per million disability adjusted life years. Finally, we calculated the Spearman’s correlation between number of trials and number of participants for trials conducted within that region and regional burden of disease. This analysis excluded 77 (7%) trials for which the location the trial could not be determined. We used Stata 12 for all statistical analyses.
Results
We screened 4190 abstracts, 2514 of which we excluded. Consequently, 1676 full text articles were reviewed (fig 1⇓). We excluded 349 of these, resulting in 1327 publications containing reports of randomised trials. Twenty two of these publications reported two randomised trials and one reported three trials, resulting in a total of 1351 disability adjusted life years. Of the 1351 identified trials, 1097 could be classified using the global burden of disease taxonomy, as 253 did not study classifiable diseases (for example, they studied risk factors or individual symptoms) and one studied yellow fever. The analysed database thus included 1097 trials. These trials covered a total of 144 diseases, of 239 potential disease categories. The median number of participants randomised (at a disease level) was 386 (interquartile range 176-1460).

Fig 1 Identification of randomised trials indexed on PubMed in December 2012
Relation between disability adjusted life years and number of randomised controlled trials and of randomised participants
We found extreme variation in the number of trials per million disability adjusted life years for each disease. Female infertility was the most over-represented disease or injury among randomised trials, with 144 trials per million disability adjusted life years, followed by adverse effects of medical treatment and male infertility (fig 2⇓; supplementary tables A and B). The least studied disease with at least one trial performed was neonatal sepsis (0.023 trials per million disability adjusted life years), followed by respiratory syncytial virus, rotavirus, self harm, and neonatal encephalopathy. The number of trials per disability adjusted life year for female infertility was 6400-fold greater than that for neonatal sepsis. In addition to these under-represented diseases and injuries, pedestrian road injury (25.6×10⁶ disability adjusted life years), Haemophilus influenza B pneumonia (21.4×10⁶ disability adjusted life years), and measles (10.4×10⁶ disability adjusted life years) had no trials performed at all.

Fig 2 Trials per million disability adjusted life years (DALYs) for 239 diseases, including diseases with no trials (n=95). Note logarithmic scale
Total disability adjusted life years per disease was a significant, albeit weak predictor of both number of published trials (Spearman’s r=0.35) and number of participants randomised (Spearman’s r=0.33) (P<0.0001 for both; fig 3⇓). Correlations were similar when estimated using univariable linear regression with log transformed number of trials and total disability adjusted life years (supplementary table C).

Fig 3 Relation between global burden of disease (total disability adjusted life years (DALYs)) and (top) number of trials and (bottom) number of randomised participants (Spearman’s r=0.35 and 0.33, respectively). Note logarithmic scales
In multivariable regression, the ratio of disability adjusted life years found in low income regions to high income regions was a significant negative predictor of the quantity of trials (P=0.009; R2=0.26 versus R2=0.14 in univariable model; supplementary table C). This indicates that 26% of the variation in number of trials could be explained by the ratio of disability adjusted life years in low income regions to high income regions and total disability adjusted life years. Estimates were similar when we excluded diseases with no trials, although the ratio of disability adjusted life years in low income regions to high income regions was no longer a significant predictor of number of participants randomised (supplementary table D).
Variation in number of randomised trials by disease-income type
We classified diseases into four categories on the basis of their relative burden in low income to high income regions and noted broad variation in the number of trials per million disability adjusted life years for disease-income categories (fig 4⇓, top). For instance, the total number of trials per million disability adjusted life years for diseases found predominantly in low income regions was 0.10, approximately sevenfold less than the total number of trials per million disability adjusted life years for diseases predominant in high income regions (0.73) (fig 4⇓, top).

Fig 4 Trials per million disability adjusted life years (DALYs) for 239 diseases, classified into four quarters according to ratio of prevalence in low income to high income regions. Top: trials per million DALYs for diseases predominant in high income regions to diseases predominant in low income regions. Bottom: variation of trials per million DALYs within disease-income categories. Note that axis on bottom graph is four times larger than that on top graph
When we further divided each disease-income category into four quarters on the basis of the number of trials per million disability adjusted life years, large variation was apparent. Among high income type diseases, the top quarter had 3.0 trials per million disability adjusted life years compared with 0.2 trials per million disability adjusted life years for the bottom quarter, an approximately 15-fold variation within high income type diseases (fig 4⇑, bottom). Whereas the top quarter of low income type diseases had 0.2 trials per million disability adjusted life years (similar to the bottom quarter of high income type diseases), the bottom 50% of low income diseases type had no trials at all. The bottom quarter of high income type diseases had fewer trials per million disability adjusted life years than did the top quarter of low income type diseases (0.15 v 0.16 trials per million disability adjusted life years). Neck pain, a high income type disease, had 0.12 trials per million disability adjusted life years (with a total of 30 million disability adjusted life years globally). This was 10-fold less than vitamin A deficiency, a low income type disease, which had 1.2 trials per million disability adjusted life years and a total of 800 000 disability adjusted life years globally. We observed similar trends when we analysed the number of randomised participants instead of the number of randomised trials (supplementary figure A).
Variation in number of randomised trials and number of randomised participants by region
High income Europe, North America, and Asia/Australia had the greatest number of trials per million population and per million disability adjusted life years, whereas south Asia/southeast Asia and sub-Saharan Africa had the fewest (fig 5⇓). High income Europe, with 0.79 trials per million population, had approximately 45-fold more trials conducted per capita compared with the region that had the fewest, sub-Saharan Africa. The association between number of trials and disability adjusted life years within a given region was moderate in high income North America (Spearman’s r=0.55), high income Europe (r=0.54), and high income Asia/Australia (r=0.45). However, in low and middle income regions, the association between number of trials and disability adjusted life years was poor (all r<0.3), particularly in sub-Saharan Africa (r=0.17), south Asia/southeast Asia (r=0.15), and central/eastern Europe (r=0.14). We observed similar trends when we analysed by number of randomised participants (supplementary figure B).
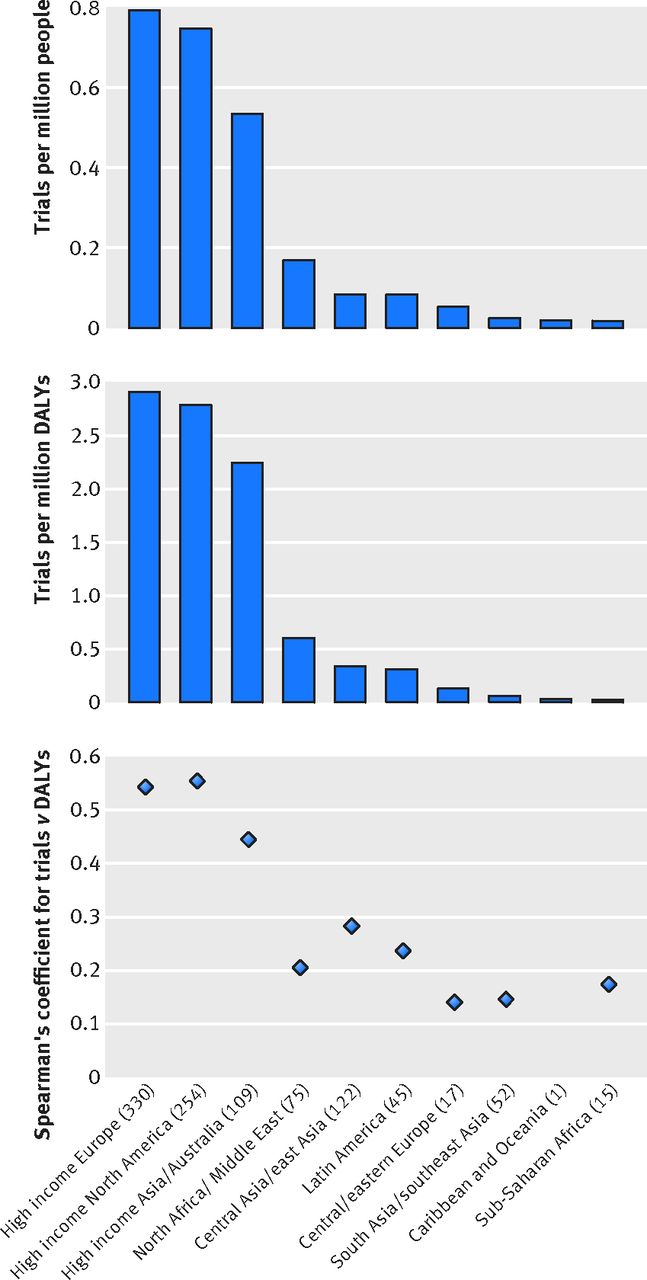
Fig 5 Top: number of trials conducted in each of 10 different regions per one million population within that region. Middle: number of trials conducted in each region per one million disability adjusted life years (DALYs). Bottom: Spearman’s correlation coefficient between burden of disease (total DALYs in each region) and number of trials conducted for 10 regions. No correlation is reported for Caribbean and Oceania, as only a single trial was performed in that region. This analysis excluded 77 (7%) trials for which location of trial could not be determined
Discussion
This study is the first comprehensive and contemporary examination of whether published randomised trial evidence is proportional to the global and regional burden of disease and builds on previous studies on the global variation in research output.2 3 We found little association across disease areas between burden of disease and quantity of randomised trials, with extreme levels of variation in the ratio of trials to disability adjusted life years among diseases. We also found that much of this variation cannot be accounted for by the relative burden of disease in high and low income regions. Finally, we found variation among geographical regions in the association between output of randomised trials and burden of disease.
Comparison with other studies
Previous research has largely focused on the assessment of differences in investment in health research in low and high income countries and on specific diseases. A recent analysis of global health research and development spending found that only 11% of global health funding occurred in low and middle income countries and that disproportionately few clinical trials were conducted in low income countries.2 Injuries and neglected tropical diseases, a class of diseases whose burden is predominantly located in low and middle income countries, have also been recognised as receiving disproportionately low research investment.4 9
In line with these past observations, we found evidence of a broad discrepancy in research output associated with the relative burden of a disease in both high income regions and low income regions. High income type diseases had, on average, 10 times more trials per million disability adjusted life years than did low income type diseases. For example, schistosomiasis, tuberculosis, neonatal sepsis, and neonatal encephalopathy, diseases that are all found predominantly in low income regions, have few trials relative to their burden of disease.
Extending beyond past analyses,2 our results also suggest that most variation in randomised trial evidence may be unrelated to the overall global burden of disease or the relative burden of disease in high and low income regions. We found remarkable variation among diseases within specific income regions, which, in some instances, was greater than the variation between regions based on income. This observation highlights the need for rigorous monitoring of trial evidence, as research output (at least in the form of randomised trials) cannot be reliably predicted from burden of disease or relative burden in high and low income regions.
We also observed variation among geographical regions in the association between randomised trial evidence and burden of disease, a finding that has, to our knowledge, not been empirically demonstrated elsewhere. Although high income regions (North America, Europe, Australia, and the Middle East) had moderate correlation between the number of trials conducted in that region and the regional burden of disease (r=0.45-0.55), low and middle income regions (eastern Europe, southeast Asia, and sub-Saharan Africa) had poor correlation (Spearman’s r<0.3). These results suggest not only that fewer trials are conducted in low and middle income regions but that the trials that are conducted and published are poorly aligned with local health needs. Although these results must be confirmed by further studies, they again suggest that rigorous monitoring of trial evidence is necessary, as regional differences in the suitability of trials to local health needs may lead to greater future regional inequity in population health.
Strengths and limitations
The strengths of this study are twofold. Firstly, it is a comprehensive and contemporary examination of whether the output of randomised controlled trials is related to the global burden of disease. Secondly, we identified all randomised trials published in PubMed indexed journals during a one month period by using a highly sensitive search strategy, with no language restrictions applied. Previous analyses have generally been restricted to a subset of general medical journals or trial registries.2 3 As only 7% of trials are published in general medical journals,10 and only 55% of published trials are registered (as measured in November 2010),11 use of these selective search strategies will probably result in biased samples.
A limitation of our analysis is that we examined PubMed for randomised trials published in a single month. Trials that were conducted but not indexed in PubMed journals would not be included in our analysis. Such trials might be systematically different from trials that were included, although the variation observed in this study is unlikely to be affected by the inclusion of a small number of additional trials. As PubMed is the largest database of health science journals and is the primary information source for most health scientists, knowledge from trials that are not published on PubMed, or from trials that are not published at all, would be less likely to reach clinicians and policy makers.10 Additionally, although we had a large total sample of 1351 trials, the numbers in specific disease/region combinations were small. This may lead to overestimation of the variation in the volume of trials on different diseases but underestimation of the correlation between the volume of trials and the burden of disease. Finally, certain diseases may be less amenable to study by randomised trial design, although this is unlikely to explain the broad variation in randomised trial evidence that we observed.
Implications for clinicians and policy makers
Calls have been made for more than 10 years to increase research investment in diseases affecting poor people,12 and global health research has been labelled as a priority by the National Institutes of Health (NIH).13 However, total spending by the NIH on neglected biomedical diseases is $1.25bn (£0.83bn; €1.06bn), approximately 4% of its total budget, and less than 1% of the NIH’s budget is targeted towards the parasitic and bacterial diseases affecting the world’s poorest billion people.14 Funding agencies must increase their spending on diseases affecting the global poor if the 10-fold variation we observed between high income and low income type diseases is to be reduced.
However, our analysis also indicates that considerable variation in research output exists for diseases within specific income categories. Two forms of oversight could potentially reduce this variation and better align research output with local and global health needs. With respect to variations within income regions, country specific funding agencies such as the NIH and the Wellcome Trust could create agencies to prioritise funding and research activity transparently. Local research oversight committees may be necessary to ensure that local health needs are met by research activity. This includes analysing disease burden and using this knowledge in priority setting, as has been previously called for in the NIH.15
With respect to the variation in research output between high and low income regions, the establishment by the WHO of a global observatory for research must be regarded as an imperative. As our results show, large variation exists in the number and distribution of randomised trials among diseases that could not be reliably predicted from either the overall global burden of disease or the relative disease burden in low and high income regions. Additionally, our results suggest the existence of regional variation in the alignment between local health needs and output of randomised trials. A continuing lack of information about research investment and consequent outputs, particularly in low and middle income countries, prevents health policy makers from making informed decisions when setting priorities, with potential adverse effects for future population health.2 For example, with the knowledge that trials of cardiovascular disorders are under-represented in a given region or are not representative of the spectrum of cardiovascular disorders within a given region, policy makers may choose to invest more funding into cardiovascular research or examine barriers to setting up large cardiovascular outcomes trials. Without dedicated monitoring, however, such “corrective” measures may not occur. A global research observatory would provide a transparent and long term mechanism for setting research priorities, a necessary step to improve research equity in global health and potentially reduce the extreme variation in trial evidence observed in this analysis.
What is already known on this topic
Previous analyses have suggested a moderate association between burden of disease and output of randomised trials for specific diseases and low income regions
Less research investment is directed towards diseases that predominantly affect people in low income regions
What this study adds
A very poor association exists between global burden of disease and the output of randomised trials for 239 diseases and injuries
Most of the variation in the output of randomised trials cannot be explained by either burden of disease or relative burden in high and low income regions
Trials conducted in low income regions may be less suited to local health needs than are those conducted in high income regions
Notes
Cite this as: BMJ 2015;350:h117
Footnotes
Contributors: CAE and AO contributed equally as first authors. CAE, AO, KR, SH, and DGA were involved in the design, implementation, and analysis of the study and in writing the final manuscript. AJH and MS were involved in the implementation of the study and in commenting on drafts of the final manuscript. CAE is the guarantor.
Funding: This study received no external funding. AO, CAE, AJH, and MS are funded by the Rhodes scholarship. KR is funded by the National Institute for Health Research (CDF-2013-06-012) and the NIHR Oxford BRC.
Competing interests: All authors have completed the ICMJE uniform disclosure form at www.icmje.org/coi_disclosure.pdf (available on request from the corresponding author) and declare: no support from any organisation for the submitted work; no financial relationships with any organisations that might have an interest in the submitted work in the previous three years; no other relationships or activities that could appear to have influenced the submitted work.
Ethical approval: Not needed.
Data sharing: Data and code are available on request from the lead author.
Transparency: The lead author (the manuscript’s guarantor) affirms that the manuscript is an honest, accurate, and transparent account of the study being reported; that no important aspects of the study have been omitted; and that any discrepancies from the study as planned (and, if relevant, registered) have been explained.
This is an Open Access article distributed in accordance with the Creative Commons Attribution Non Commercial (CC BY-NC 4.0) license, which permits others to distribute, remix, adapt, build upon this work non-commercially, and license their derivative works on different terms, provided the original work is properly cited and the use is non-commercial. See: http://creativecommons.org/licenses/by-nc/4.0/.