Screening for the top 10 deep value AIM stocks
10th December 2014 12:54
This is the fifth article in our series on how to screen the stockmarket for winners. Last week we introduced a checklist devised by Professor Joseph Piotroski which has a canny knack of separating the winners from losers in baskets of value stocks. This week we introduce the ideas of the popular quant James O'Shaughnessy, and his startling techniques for building market-beating value portfolios. Read on to find out how to rank the stockmarket for value.
Choose your weapons carefully
Our old friend Ben Graham once said that "in the short run the market is a voting machine but in the long run it's a weighing machine" snappily illustrating one of the critical ideas for stock market success - that the market over-reacts and mean reverts. This is the value effect writ large, that portfolios of cheap stocks have a tendency to outperform expensive stocks.
But how do you define cheap? While there are advanced techniques for figuring out the intrinsic value of a share, most private investors prefer to use relative value ratios which allow quick comparison between stocks.
In general relative valuation is done by comparing a company's share price against either what it earns or what it owns. The price/earnings (P/E) ratio, price/cashflow (P/CF) ratio, dividend yield, EV/EBITDA ratio, price/sales (P/S) ratio all aim to judge price against what a company earns, while price/book (P/B), price/tangible book, price/net current assets, price/cash (P/C) and so on all compare a share's price against what it owns.
Investors are a very sectarian bunch and usually stick to one or a few of these ratios rigidly - dividend investors build portfolios with the yield, private equity choose companies using EV/EBITDA measures, asset turnaround specialists like book value measures. Almost all the studies into value investing have found that over the long term the returns to portfolios based on any of these value ratios are correlated and have similar risk and return profiles.
What one does find though is certain styles of value ratio come into vogue at different times in different market cycle. A brief glance at recent history shows that this is so:
● In the late nineties the price to sales ratio was the most effective measure as dotcom companies couldn't be valued on profits.
● In the recoveries from most bear markets the biggest bargains judged by asset based measures (P/B, P/C) often massively outperform.
● Between 2002-2007, EV/EBITDA based metrics were all the rage as the credit bubble grew and private equity sought to buy companies outright.
● More recently in this low interest rate era the dividend yield has been among the most successful value metrics as investors have thirsted for yield.
So how can one build a perennial strategy based on a just one of these ratios? If you stick to the P/E ratio at all times you could find that you massively underperform the market for a lengthy period as it falls out of vogue. Nobody can handle that kind of underperformance and the risk is you throw in the towel on your strategy right at the wrong time. Is there a solution?
 Reduce risk and improve returns with a "composite" value rank
James O'Shaughnessy has become one of the great popularisers of systematic investing based on fundamental statistics. Born in 1960 he's the founder, chairman and CEO of OSAM (O'Shaughnessy Asset Management) but is possibly most famous for his immensely influential 1997 publication "What Works on Wall Street".
In the fourth edition published recently, he illustrates how to build a composite value score for every stock in the market that blends a set of six standard value ratios - P/S, P/E, P/B, P/CF, EBITDA/EV, and yield.
Imagine taking a spreadsheet and sorting all the stocks by their P/E ratio from expensive to cheap. Each stock is ranked from 1 (expensive) to 100 (cheap) in this set, and the process is repeated for each of the other valuation ratios. Once complete, a "composite" is calculated as the average of all.
Given the above background about how different ratios perform better in different eras, it's perhaps unsurprising that if you'd bought the cheapest stocks in the market based on this composite measure you'd have got better overall returns with less risk than using the ratios individually.
For example between 1964 and 2009 - using P/S alone - the cheapest 10% of stocks picked by their P/S ratio returned 14.49% with a standard deviation (volatility) of 20.68%. But by using the composite value rank instead the return was improved to 17.3% and the standard deviation reduced to 17.1%. More returns at less risk!
But does it really work?
At Stockopedia.com we've been using a similar technique to create our ValueRank - one of a set of StockRanks that score all the companies in the UK markets for value, quality, momentum and growth. The performance of the ValueRank has been startling to date, with the top 10% cheapest stocks by this measure massively outperforming the market - returning 22% vs the FTSE All Share's 6% since April 2013.
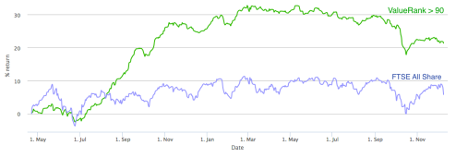
(click to enlarge)
The top 10 AIM stocks by market cap currently qualifying in the top 5% "cheapest" shares in the market by this O'Shaughnessy inspired ValueRank measure are listed in the table below.
Just to add fuel to the fire comes right at the top of the cheap bucket - massive problems at this software company make this certainly not a stock for widows and orphans - though others on the list are no less controversial. , , and top the list - while the full list of 23 stocks can be found at the Stockopedia.com website.
| Ticker | Name | Mkt Cap £m | Value Rank | P/E | Industry group |
| QPP | Quindell | 198.5 | 99 | 1.03 | Software & IT Services |
| CNKS | Cenkos Securities | 114 | 95 | 4.48 | Investment Banking & Investment Services |
| HGM | Highland Gold Mining | 107.3 | 99 | 3.09 | Metals & Mining |
| TMMG | Mission Marketing | 36.7 | 95 | 9.35 | Media & Publishing |
| MWA | Mwana Africa | 34.6 | 95 | 2.31 | Metals & Mining |
| NPT | NetPlay TV | 21.9 | 97 | 7.22 | Hotels & Entertainment Services |
| ZIOC | Zanaga Iron Ore | 21.6 | 96 | 2.73 | Metals & Mining |
| ROL | Rotala | 21 | 95 | 9.92 | Passenger Transportation Services |
| EMR | Empresaria | 20.1 | 96 | 7.18 | Professional & Commercial Services |
| TNG | Tangent Communications | 17.3 | 95 | 10 | Professional & Commercial Services |
A running theme amongst deep value investing is that one has to be brave - but loading up on any one of these shares would be extremely foolhardy. O'Shaughnessy taught that one should always buy at least 25 stocks in a systematic portfolio to minimise the risks that one or many of the stocks (like Quindell) has a disaster - diversification is the only free lunch in investment - take advantage of it!
About Stockopedia
Interactive Investor's Stock Screening series is written by Ed Page Croft of Stockopedia.com, the rules-based stockmarket investing website. You can click here to read Richard Beddard's review of Stockopedia.com and learn more about the site.
● Interactive Investor readers can enjoy a 2 week free trial and £50 discount to Stockopedia using the coupon code iii014 - click here.
● To learn more about Ben Graham and his deep value investing strategies, you can download the free Stockopedia book, How to Make Money in Value Stocks.
It's worth remembering that these and other investment articles on Interactive Investor are simply for generating ideas and if you are thinking of investing they should only ever be a starting point for your own in-depth research before making a decision.
*No fee for publication is involved between Interactive Investor and Stockopedia for this column.
 About the author

Edward Page Croft is the CEO and founder of Stockopedia.com. His background is in wealth management and engineering, having worked as a private client broker at Goldman Sachs before founding Stockopedia.
He graduated from Oxford University with first class honours and is a Zend Certified PHP Engineer. Edward writes regularly for This is Money, Business Insider and the London Stock Exchange's Private Investor Magazine. He is the author of several ebooks including "How to Make Money in Value Stocks".
This article is for information and discussion purposes only and does not form a recommendation to invest or otherwise. The value of an investment may fall. The investments referred to in this article may not be suitable for all investors, and if in doubt, an investor should seek advice from a qualified investment adviser.
Editor's Picks