- EURUSD 1.2230 and 1.2330 are big levels
- USDJPY rams into a Fibonacci level
- AUDUSD range favored above long term parallel
--Subscribe to Jamie Saettele's distribution list in order to receive a free report to your inbox thrice a week.
EUR/USD
Monthly
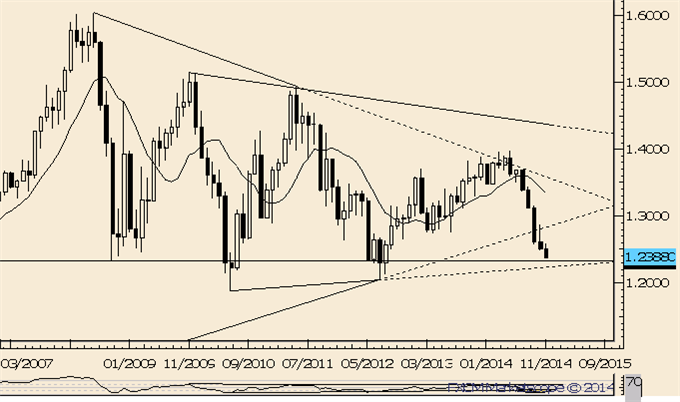
Chart Prepared by Jamie Saettele, CMT using Marketscope 2.0
Automate trades with Mirror Trader
-BIG picture, monthly RSI has broken out of a triangle pattern. Sometimes, a pattern breakout in momentum (or OBV) precedes the breakout in price. The development’s implications are obviously significant.
-After following through on the 11/7 reversal and exceeding the 11/4 high, it appeared that EURUSD was going to make an attempt at an important 1.2665/85 Fib zone before selling returned. That all changed in the course of a few hours on Friday. Still, the monthly is displayed in order to highlight the importance of the area just below. The line from the 2010 and 2012 lows is near 1.2230 next week whilst the 2008 low looms at 1.2330.
GBP/USD
Daily
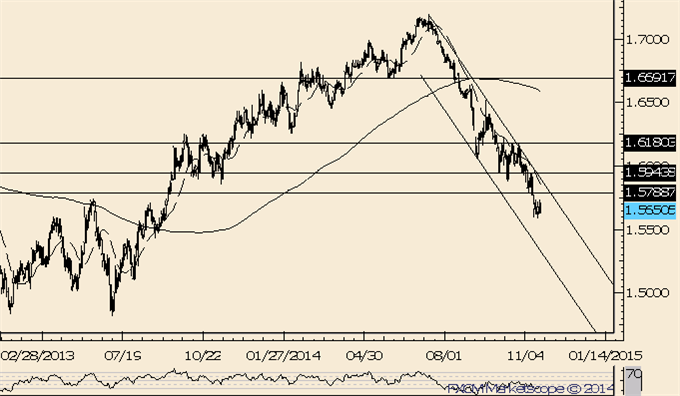
Chart Prepared by Jamie Saettele, CMT using Marketscope 2.0
Automate trades with Mirror Trader
-“GBPUSD is at a crossroads. The trend is down against 1.6184 but recent activity warns of a turn. The rate carved a key reversal last week and action since the low is constructive (decline from 1.6184 found low at the 61.8% of prior rally). Exceeding 1.6184 would confirm a 3 week bottoming pattern and yield an objective near 1.65.”
-“The rate traded 1.6181 this week before sinking to new lows. Favor the downside as long as price is below trendline resistance.”
AUD/USD
Monthly
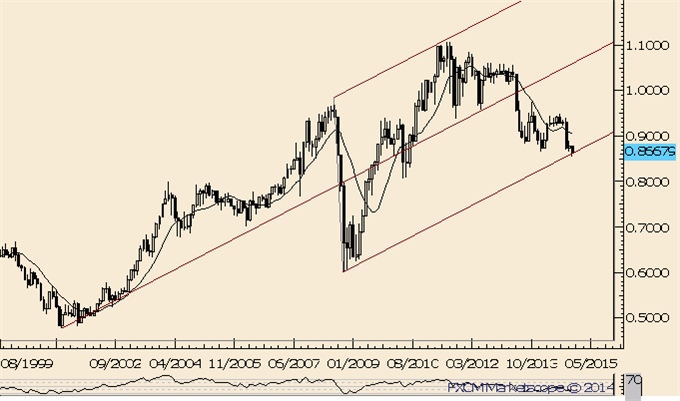
Chart Prepared by Jamie Saettele, CMT using Marketscope 2.0
Automate trades with Mirror Trader
-“The combination of the .9400 figure and weekly RSI failing near 60 indicates a lot of overhead to punch through. Since the 2011 top, each RSI failure near 60 has led to a top or topping process (range for several weeks then a breakdown...that may be the case now).”
-“Weakness has extended below the line that extends off of the 2008 and 2014 lows, warning of something much more significant on the downside. The 10/29 outside day reversal keeps me looking lower. A new low would expose expansion objectives at .8476 and .8373.”
-“AUDUSD made fresh lows this week but Friday’s outside day reversal, at a long term median line parallel nonetheless, should not be ignored.” The rate continues to churn at the mentioned line. Clearly, this level is a tough nut to crack so respect potential for additional range trading.
NZD/USD
Weekly
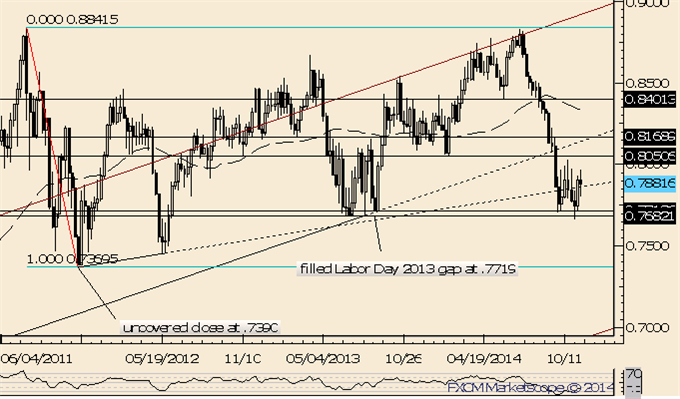
Chart Prepared by Jamie Saettele, CMT using Marketscope 2.0
Automate trades with Mirror Trader
-“Don’t forget about the line that extends off of the 1996 and 2007 highs. That line crosses through the 2008, 2011, and highs as well. In 2011 (record free float high), the rate surged through the line in late July before topping on August 1st. The rate reversed this week from pips below the record high and above the mentioned line.”
-“The gap from Labor Day 2013 has held as support but last week’s spike into .8034 (just shy of the February low at .8050) probably completed 3 weeks of consolidation. In other words, start looking lower again. Ultimately, weakness below .7370 would confirm a double top with an objective of .5898.”
-“The Bird traded under the 2013 low 2 weeks ago but be aware of slowing momentum (RSI divergence + RSI > 30 on the daily) and the ending diagonal from the 10/21 high.”
USD/JPY
Monthly
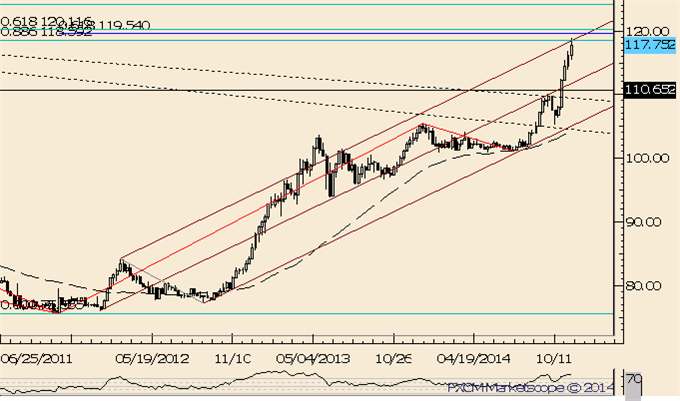
Chart Prepared by Jamie Saettele, CMT using Marketscope 2.0
Automate trades with Mirror Trader
-USDJPY traded into an upper median line parallel this week as well as the 88.6% retracement of the decline from the 2007 high. The 61.8% of the decline from the 1998 high is at 120.12 and the gap measurement (from 11/3) yields 119.84. The 120 area does indeed appear significant. Know also that daily RSI has been above 75 for 16 consecutive days now. The only other time in history that has happened was in…September (for 17 days)! That streak ended on September 30th (1 day before a 500 point drop).
USD/CAD
Weekly
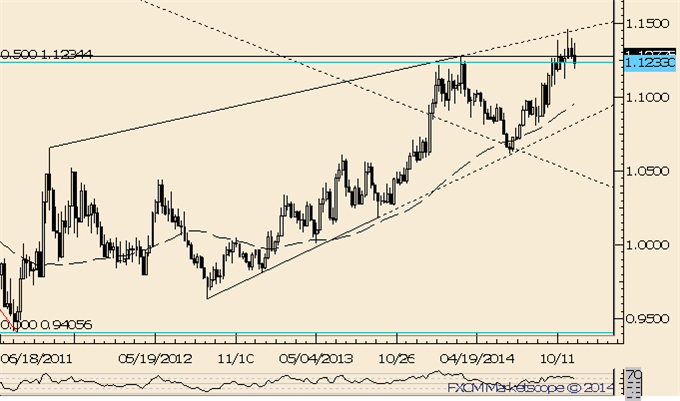
Chart Prepared by Jamie Saettele, CMT using Marketscope 2.0
Automate trades with Mirror Trader
-“USDCAD traded to its best levels since July 2009 this week but finished in the middle of its range for the week. The close and weak momentum profile casts doubt regarding the validity of the breakout but continue to look higher as long as price is above 1.1080. The rate also encounters potential resistance near 1.1450 from the upward sloping line that connects the October and 2011 and March 2014 highs.”
-This trend high remains 1.1465, a few ticks above the mentioned upward sloping line. USDCAD is at support now but failure to hold 1.1120 opens up 1.10 (200 DMA and August high).
USD/CHF
Weekly
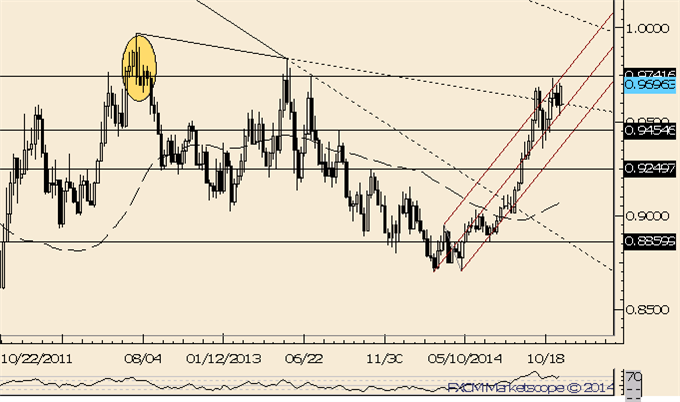
Chart Prepared by Jamie Saettele, CMT using Marketscope 2.0
Automate trades with Mirror Trader
-“USDCHF weakness has reset the market for another rally attempt. Remember, USDCHF broke above the trendline that extends off of the 2001 and 2010 highs. Like EURUSD, USDCHF monthly RSI broke from a potentially long term basing pattern. As long as .9358 holds, look higher.”
-“.9740 could serve as resistance for the next top.” The top thus far is .9740 but reversal risk remains high as per sentiment (COT). Bullish risk is moved to .9530.
original source


