Russell 2000 Attempting To Retrace Bullish Harmonic Pattern
TFU14 is the Emini futures for the Russell 2000, and the intraday chart shows price has retraced a harmonic pattern called a Bearish Crab 88.6% with the help of a completion of another harmonic pattern, called an Alternate Bullish Bat, which is now attempting to go into retracement mode. This is one of the great things about harmonic patterns, they are fractals and one or many harmonic patterns will help another pattern play out.
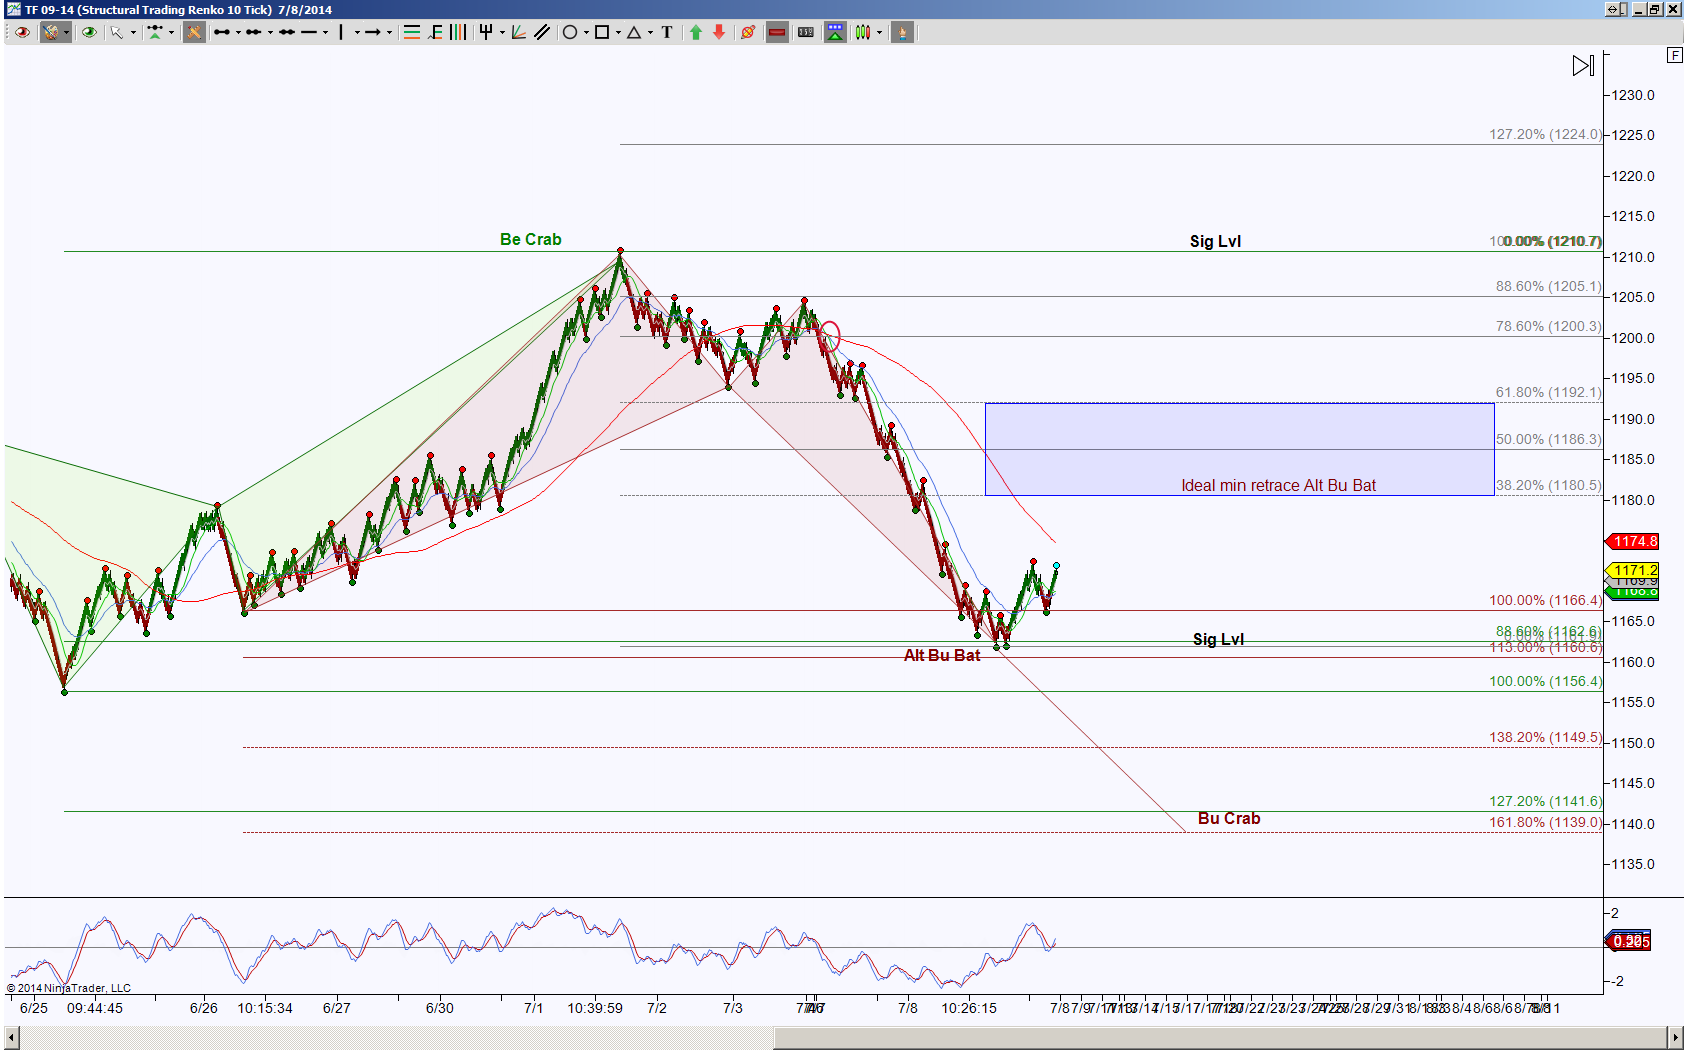
This STRenko 10 bar chart is what I’m using for an intraday perspective. The visual of harmonic patterns often gives us the “ah, that’s what you mean” understanding. As we can see, the green colored Bearish Crab has retraced 88.6%, this is a nice retracement since harmonic patterns’ ideal target is a 100% retracement. It never ceases to amaze me how harmonic patterns are so in-tuned with price action. For instance, the brown colored Alternate Bullish Bat ideal PRZ target is 1160.6, this correlates with the 88.6% retracement level of 1162.6 and this zone is where price began to bounce. Now the focus is pointed to how much will this newly completed harmonic pattern retrace. Its ideal minimum target is 1180.5 and should price reject that level or fail to get there, it increases the probability of downside continuation with targets at the retest of the PRZ 1160.6 region or even the extended target of 1139. If price is able to hold above 1180.5, the probability increases to test 1192.1 and above there increases the probability of retracing 100% or more.
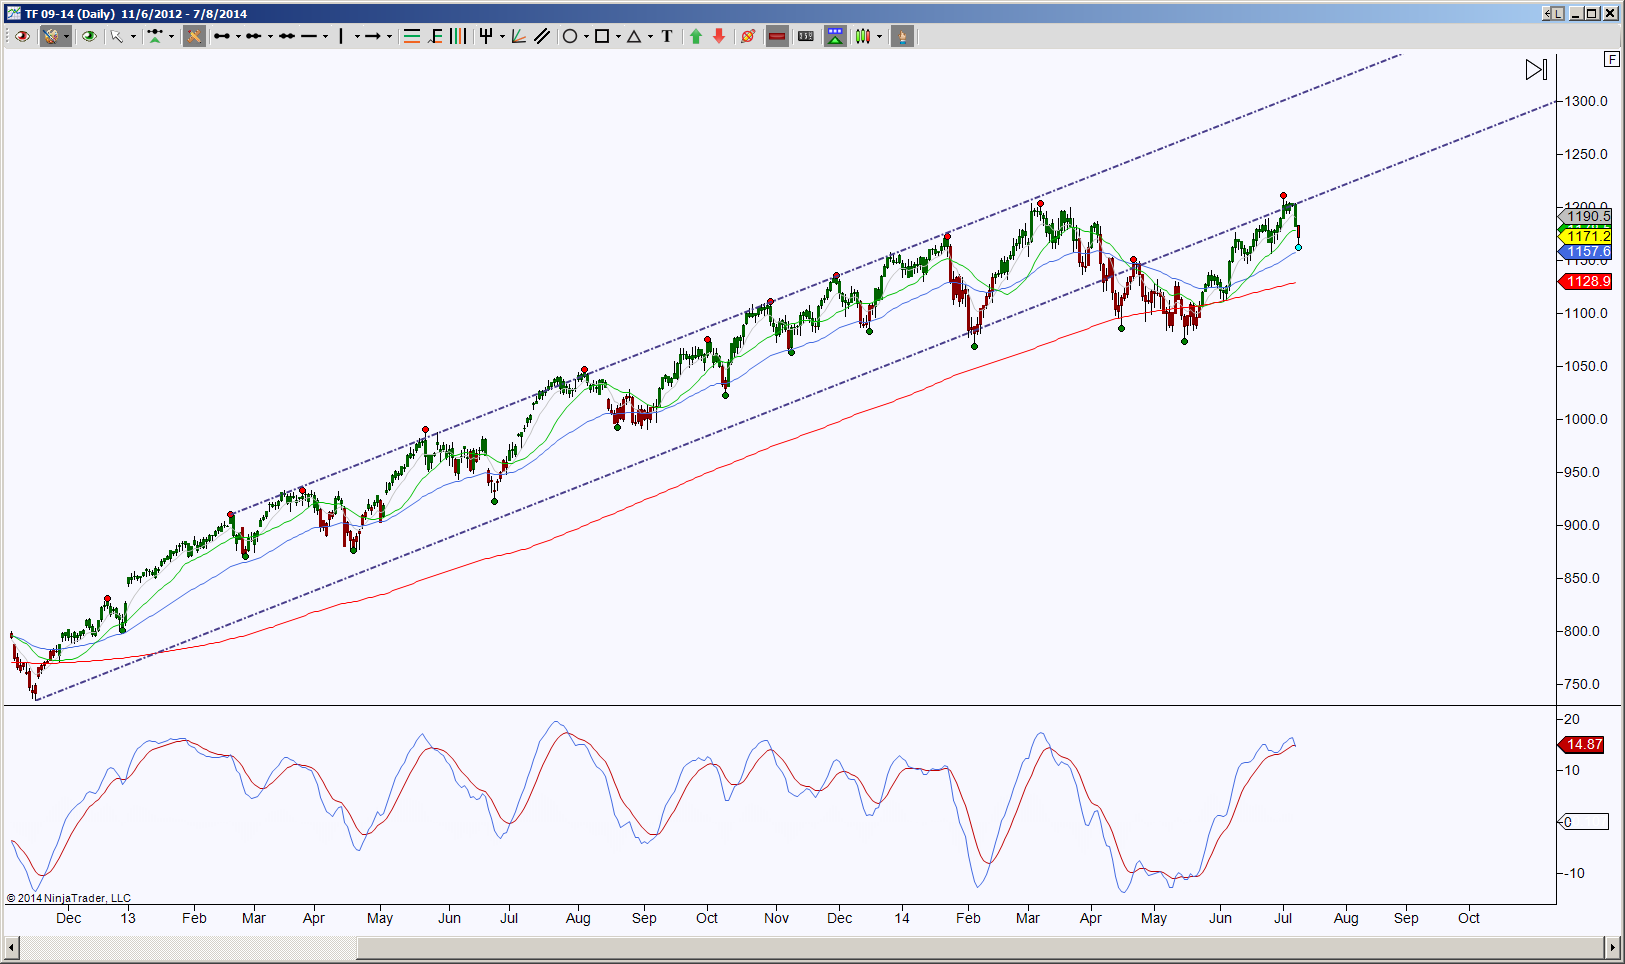
Daytraders can utilize this bar size chart for shorter term trades, but this chart also will help the longer-term trader have a better view of how price is behaving at a long-running uptrend channel that has been broken. This day chart shows price has been attempting to shift the bias by closing below the channel and bouncing into the bottom of the channel for a resistance test. So how price behaves on the intraday perspective offers probability scenarios of whether price will push back inside the channel or move further away from it.
To elaborate, if the intraday Alternate Bullish Bat has a strong retracement, it will take out each gray Fibonacci level with the 1180.5 being the initial hurdle; a strong retracement will help price push back inside the uptrend channel.
Failure to retrace this Alternate Bullish Bat increases the probability of testing 1139. This helps the Day chart price to near its 200 moving average which is a means of a support in itself.
So currently the intraday perspective has an upside bias while attempting to test retracement fibs and 1180.5 is the initial key level to keep an eye on, thereafter we have the clues outlined above.
