Some weeks feature a contrast between past and future -- a possible inflection point. Here are the current elements:
- Important economic data with a forward look;
- Earnings news from major companies reporting on Q1'14;
- Corporate conference calls explaining the outlook for future earnings; and finally
- Economic implications for improved economic growth and business conditions worldwide.
It is a big week for news and data.
Prior Theme Recap
Last week I expected the theme to emphasize volatility. The market was at interesting technical levels and there was plenty of news to push it one way or the other. In a sense I was right about the theme, since the talking heads made the moderate crossings of "unchanged" seem like big news. The volatility cocktail was more like a Shirley Temple.
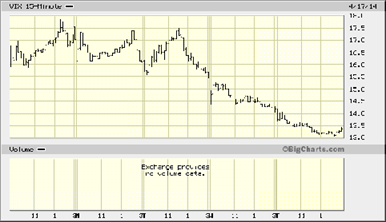
The potential was there, but the economic news was mostly calming. The contribution of mixed corporate earnings was enough to prevent a major market move either way. It is easy to measure volatility objectively. The VIX index gauges the market expectations for changes in the S&P 500. (If you spend five minutes with this post from Bill Luby at VIX and More, you'll know more than almost anyone about the VIX). Here is the chart for the week:
By the end of Thursday's trading, the options market was already factoring in a quiet three-day weekend.
While the volatility theme did not play out last week, it looked promising on Monday and Tuesday. Here is what I wrote last week:
If earnings satisfy, it might have a calming effect. This will be especially true if we get a little more confidence in forward outlook, some hints about future hiring, and more planned capital expenditures. In that case we could have a rebound, with plenty of reduction in the VIX.
As I try to emphasize, forecasting the theme is an exercise in planning and being prepared. Readers are invited to play along with the "theme forecast." I spend a lot of time on it each week. It helps to prepare your game plan for the week ahead, and it is not as easy as you might think.
Naturally we would all like to know the direction of the market in advance. Good luck with that! Second best is planning what to look for and how to react.
This Week's Theme
At economic inflection points, it is normal to have a mix of optimists and pessimists.
- Representing the pessimists we have a trader perspective that was well-received at Seeking Alpha. The argument is one I frequently hear from trader friends and individual investors. The author examines various trends before concluding as follows:
Hence, I expect the Fed to continue with its one-size-fits-all approach of QE, opting to reverse tapering and return its foot on the monetary accelerator. But, having largely continued stalling for the past five years, I also expect the gears of the economy to remain stuck in neutral. A stagnant economy that is held up artificially and not allowed to correct naturally but that also lacks the inherent energy and dynamism to grow with any persistence and sustainability.
- On the side of the cautious optimists (the only brand we see), Chuck Mikolajcak at Reuters has the story: Wall Street Week Ahead: Spring fever brings hope for U.S. earnings. He notes that the upcoming reports reflect a cross-section of companies, an end to cold weather worries, and special attention to Chinese growth slowing.
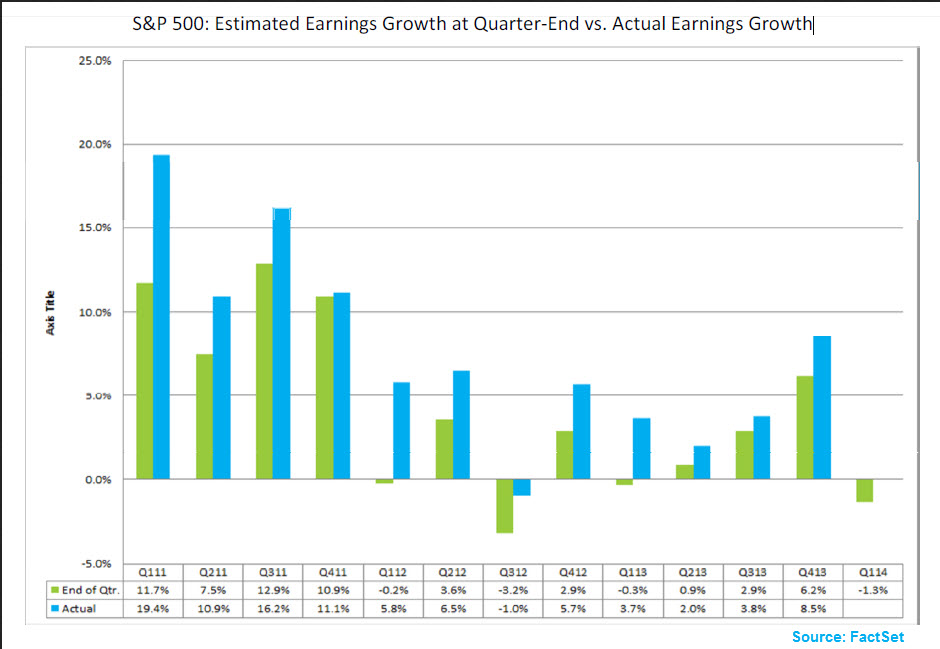
- A more balanced look comes via Josh Brown. He notes that we might see the first actual decline in quarterly earnings since 2012, and explains the lower and beat pattern of the expectations game. Josh writes as follows (and also provides a helpful chart):
…(T)he good news is that analysts have been willing participants in the beat-and-lower phenomenon for years now. You can see the downward revisions (green bars) being handily exceeded by actual results almost every time. Beat rates for the S&P as a whole have been running at a rate of 60 to 70% pretty consistently for the period pictured. We'll see if they can pull it off again and avoid the first quarter of year-over-year negative earnings growth since Q3 2012.
From these sources, it would seem that we should not expect much economic and market optimism, even as the weather improves. As usual, I have some thoughts that I will share in the conclusion. First, let us do our regular update of the last week's news and data. Readers, especially those new to this series, will benefit from reading the background information.
Last Week's Data
Each week I break down events into good and bad. Often there is "ugly" and on rare occasion something really good. My working definition of "good" has two components:
- The news is market-friendly. Our personal policy preferences are not relevant for this test. And especially -- no politics.
- It is better than expectations.
The Good
There was plenty of economic news, and on balance it was very good.
- Rail traffic is showing strength. GEI has good advice on how to look past the noisy weekly data. The post also has plenty of charts for those who want to do their own research.
- Hotels are having a big year, the best since 2000 according to Calculated Risk. That squares with my own travel experience.
- Fed news was positive. The Beige Book showed a positive outlook (via the WSJ) and Fed Chair Yellen made an encouraging speech, without any slips about the timing of rate increases.
- Retail sales rose 1.1% beating expectations.
- Greece bond yields decline further, now below 5%. Felix Salmon has a nice post citing the top five reasons for the successful auction. Your favorite perma-bear or conspiracy site either did not mention this news, or asserted that disaster still looms. It is interesting that some use "kicking the can" to apply to policies, but not to their own errant predictions. If you missed my "Faceoff" piece – Jeff versus John Mauldin on the record you can see what we both thought a few years ago. That is always more challenging than coming up with reasons after you know what happened.
- LA port traffic has hit another new high. Bill McBride at Calculated Risk has the full story and charts, concluding, "This suggests an increase in trade with Asia in March."
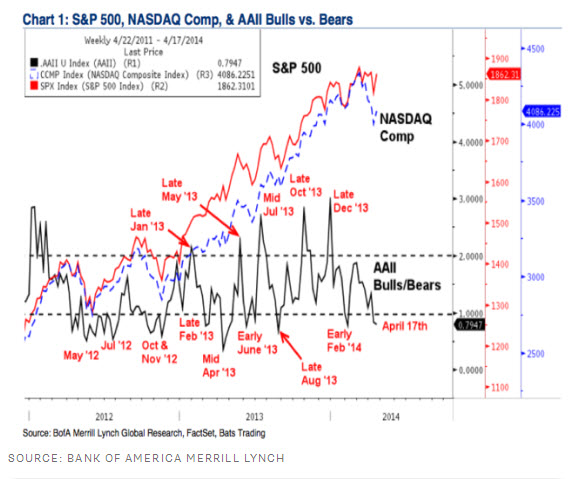
- Sentiment is more negative and that is a positive since it is a contrarian indicator. Barry Ritholtz explains and provides this chart:
- Industrial production beat expectations. Scott Grannis sees this as part of an overall picture of economic strength. (Full discussion with charts).
The Bad
There was also some bad news, but not much. I am sure that some of my commenting community will want to add some bad news, but remember that it is supposed to be something that happened last week.
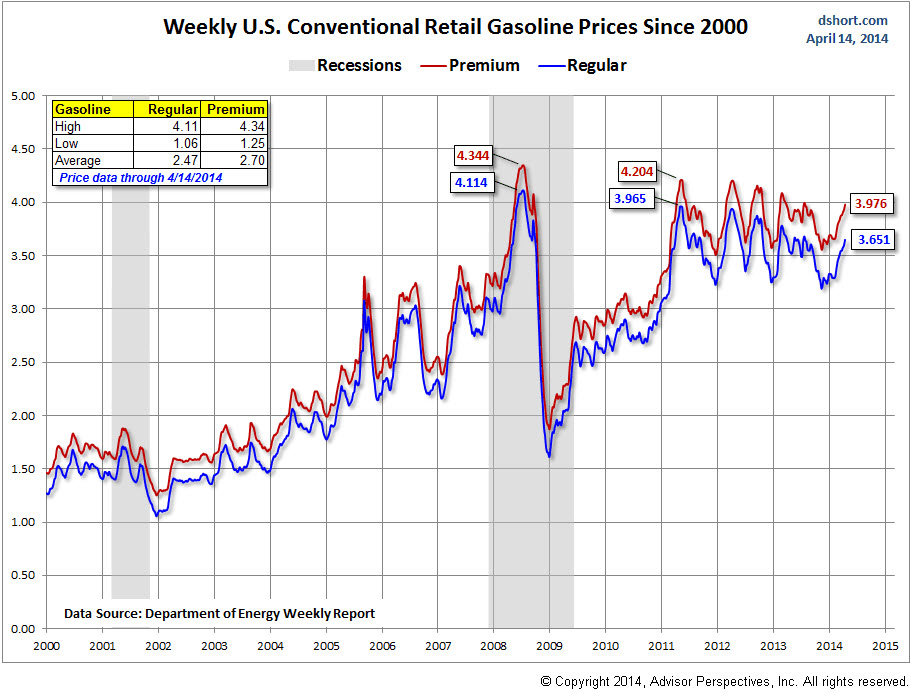
- Gasoline prices continue to rise. The move has surprised many. Doug Short has a great chart and plenty of additional background in his post.
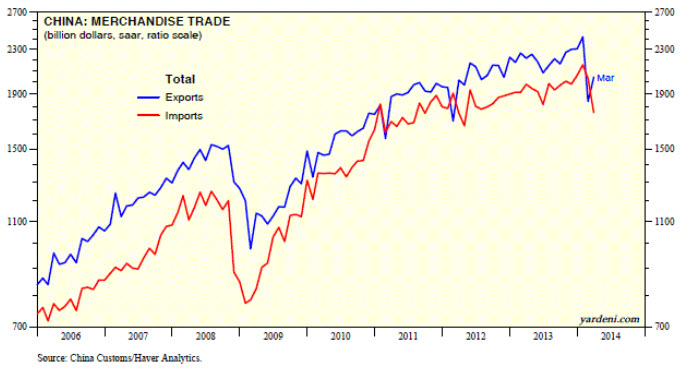
- China disappointed in several economic fronts. The headline GDP report of 7.4% growth missed the official 7.5% target. While markets seemed to expect this, this does not suggest more stimulus. Ed Yardeni reports on weak exports, deflationary signals, and the failure to sell about a quarter of a one-year bond offering. The finance minister would not offer an adequate yield. Here is a great chart on the disappointing China progress:
- Housing starts show modest growth. Building permits also remain weak. Calculated Risk continues to see a "wide bottom" in these indicators with a positive outlook. See the full post for more color.
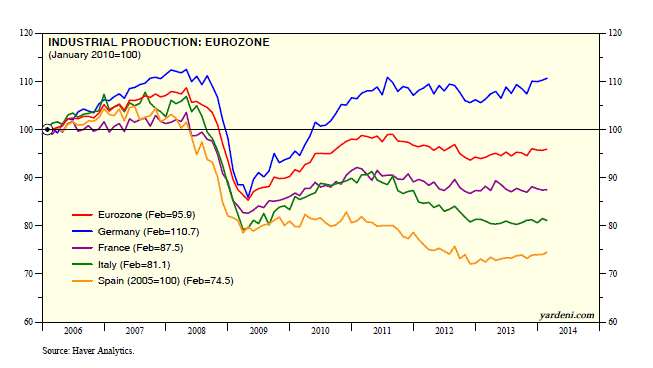
- Eurozone growth is lagging. Ed Yardeni suggests that we need a magnifying glass to see progress from last summer. Here is a key chart:
The Ugly
Germs. There is a lesson here about perception and reality. There is a modest risk from a disgusting source, and a big risk from a routine one. Which do you suppose gets a public reaction?
Dirty money (via the WSJ) explains that "a body temperature wallet is a petri dish" for microbes. It is something to think about the next time you see a food worker handling money. But then you often do that yourself right before eating.
Portland empties a reservoir after security cameras showed a thoughtless and selfish act. This had a negligible effect, but it was widely reported.
Quant Corner
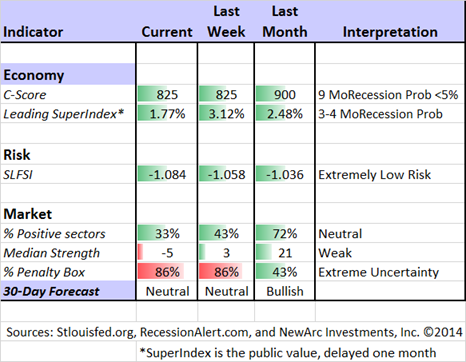
Whether a trader or an investor, you need to understand risk. I monitor many quantitative reports and highlight the best methods in this weekly update. For more information on each source, check here.
Recent Expert Commentary on Recession Odds and Market Trends
Georg Vrba: Updates his unemployment rate recession indicator, confirming that there is no recession signal. Georg's BCI index also shows no recession in sight. For those interested in Canadian stocks, Georg has unveiled a new system.
RecessionAlert: Great work on the "Yellen Dashboard". Dwaine's fans should also check out his S&P warning system, based on market breadth.
Bob Dieli does a monthly update (subscription required) after the employment report and also a monthly overview analysis. He follows many concurrent indicators to supplement our featured "C Score." One of his conclusions is whether a month is "recession eligible." His analysis shows that none of the next nine months could qualify. I respect this because Bob (whose career has been with banks and private clients) has been far more accurate than the high-profile punditry.
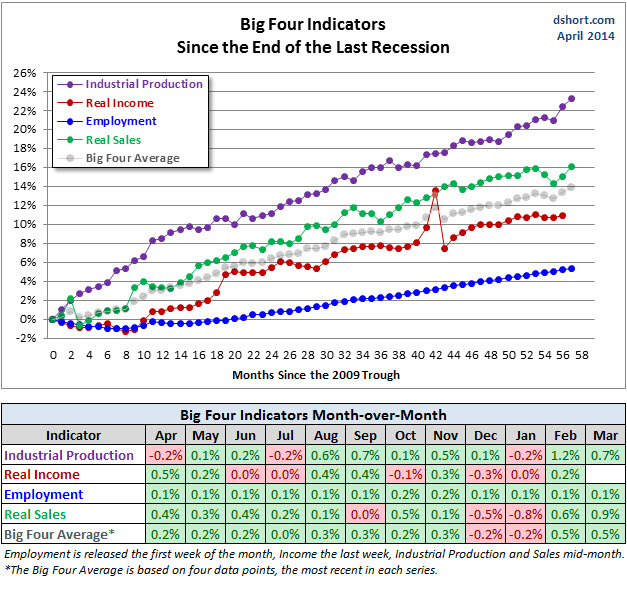
Doug Short: An update of the regular ECRI analysis with a good history, commentary, detailed analysis and charts. If you are still listening to the ECRI (2 ½ years after their recession call), you should be reading this carefully. Doug also has an update of his "Big Four" chart, examining the most recent data. This is the single best look at concurrent indicators of a potential business cycle peak:
The Week Ahead
We have plenty of news and data in a short trading week.
The "A List" includes the following:
- New home sales (T). Important read on both housing sector and economic growth.
- Initial jobless claims (Th). Best concurrent read on employment. Will the improvement be maintained?
- Michigan Sentiment (F). Best way to get concurrent information on spending and employment.
- Leading indicators (M). Somewhat controversial, but still widely followed. A big jump is expected.
The "B List" includes:
- Existing home sales (T).
- Durable goods orders (Th). March data important to GDP.
- FHFA housing prices (T). Very accurate, but only for a subset of housing.
Former Fed Chairman Bernanke speaks in Toronto on Tuesday. ECB President Draghi speaks on Thursday.
The big news is the avalanche of earnings reports.
How to Use the Weekly Data Updates
In the WTWA series I try to share what I am thinking as I prepare for the coming week. I write each post as if I were speaking directly to one of my clients. Each client is different, so I have five different programs ranging from very conservative bond ladders to very aggressive trading programs. It is not a "one size fits all" approach.
To get the maximum benefit from my updates you need to have a self-assessment of your objectives. Are you most interested in preserving wealth? Or like most of us, do you still need to create wealth? How much risk is right for your temperament and circumstances?
My weekly insights often suggest a different course of action depending upon your objectives and time frames. They also accurately describe what I am doing in the programs I manage.
Insight for Traders
Felix has once again continued with a neutral rating. We have been completely out of US equities, but fully invested for trading accounts – all in Latin America or China. This was not as good as the US ETFs last week. Given the current ratings, it is possible that Felix will give a buy signal on an inverse ETF this week.
Those who want to follow Felix more closely can check us out at Scutify, where he makes a daily appearance to join in vigorous discussions about trading. This assumes that I can awaken him from his Spring fever and the attractions of those "high-frequency" models so popular here in Chicago.
Insight for Investors
I review the themes here each week and refresh when needed. For investors, as we would expect, the key ideas may stay on the list longer than the updates for traders. The current "actionable investment advice" is summarized here.
This is still an important time for long-term investors. We all know that market corrections of 15% or so occur regularly without any special provocation. Recent years have been the exception. Over the last several weeks I have emphasized the need to maintain perspective, using market declines to add to positions.
It helps if you have been actively rebalancing your portfolio and trimming winners. Then you have some cash. Some readers have asked me to write more on this topic, so I have placed it on the agenda. For now, let me do a quick summary:
- Review your holdings regularly. (For me, that means at least weekly, but it is my day job. Quarterly is probably enough for most people, perhaps with some price alerts). Make sure that your original reasons for the investment are still valid. Revise your fair value and price target estimates.
- Do not fall in love with a position. If hanging on to a disappointing holding, make sure your reasons are sound.
- Sell if your price target is hit.
- Rebalance by trimming if a stock appreciates massively, but remains below the price target.
Because we have been selling in our "long stock" program, we have prepared to buy on dips. We are following the rules that I have recommended for you. I have not added to these positions yet, but we are shopping. I am especially interested in regional banks, energy and some "old tech."
Those following our Enhanced Yield approach should have had a great month and quarter. We have experienced only modest volatility, continuing to beat our upside target for the year despite overall market losses. It is important and helpful to own value stocks that pay dividends and add some hedging via short calls. I have written several times about examples that you can try on your own. It reduces your risk. Start small and get the sense of how to do it.
Here are some key themes and the best investment posts we saw last week:
Beware the Bubble Talk. It just does not stop. When one sign or signal fails, the enterprising bubble community finds a new one. Now it is the number of IPO's. Barry Ritholtz has a nice column at Bloomberg, analyzing five different indicators raised by Mark Hulbert. It is worth it to read the entire piece, and all the specific points, reaching the conclusion:
Taken as a whole, these five points suggests that speculation hasn't run rampant today the way it did in 2000. The list above contains two strong points, one moderate and two that perhaps could be rationalized away.
The conclusion is that we are not in a speculative bubble.
I will add that if there were few IPO's, that would be cited by many as a sign of market weakness. This is what comes from starting with a conclusion – more of a mission – and then seeking an argument.
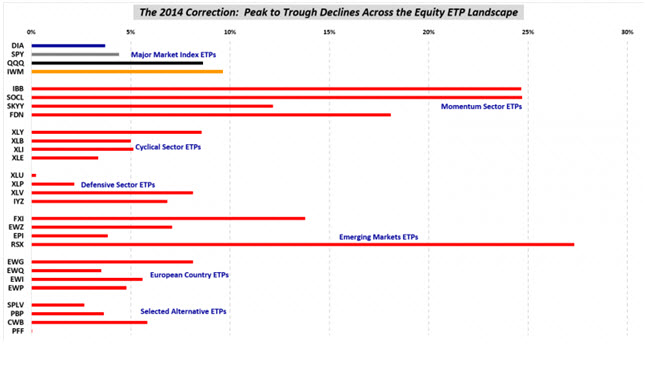
Some sector selling might be excessive. It is early for any firm conclusions, but this is how you build your watch list. Bill Luby has an interesting analysis of the 2014 correction (!?). This gets plenty of media play. In fact, it is pronounced in some sectors and hardly noticeable in others. This is a good summary chart:
Energy is worth a look, according to earnings expert Brian Gilmartin. As he notes, I agree.
Dividend stocks can be dangerous. Some have yields that cannot be sustained or have reached excessive valuation levels. Michael Fowlkes offers some specific suggestions.
A simple timing method from Eddy Elfenbein will surprise you. It is much more powerful than the normal seasonal ideas you hear so much about. Just stay invested as long as inflation is between 0% and 5%. He writes as follows:
A few years ago, I ran the numbers on how the stock market reacts to inflation. Here's what I found:
Now let's look at some numbers. I took all of the monthly returns from 1925 to 2012 and broke them into three groups. There were 75 months of severe deflation (greater than -5% annualized deflation), 335 months of severe inflation (greater than 5% annualized), and 634 months of stable prices (between -5% and +5%).
The 75 months of deflation produced a combined real return of -46.77%, or -9.60% annualized. The 335 months of high inflation produced a total return of -70.84%, or -4.32% annualized. The 634 months of stable prices produced a stunning return of more than 177,000%. Annualized, that works out to 15.21%, which is more than double the long-term average.
Here's an interesting stat: The entire stock market's real return has come during months when annualized inflation has been between 0% and 5.1%. The rest of the time, the stock market has been a net loser.
Investors might enjoy seeing Eddy's speech to The Motley Fool.
If you are obsessed about possible market declines, you have plenty of company. This is one of the problems where we can help. It is possible to get reasonable returns while controlling risk. Check out our recent recommendations in our new investor resource page -- a starting point for the long-term investor. (Comments and suggestions welcome. I am trying to be helpful and I love and use feedback).
Final Thought
There is a great divide in the economic blogosphere.
On one side you have non-economists who write pop economics. They are good with numbers and charts, and they speak a language that is plausible for a mass audience. The average person in the US claims economic expertise from being a consumer! Articles from these sources are replete with charts and references to headwinds. These are often "strategists" or people who became Wall Street economists without every studying the subject. Some are famous for being famous.
On the other side you have those with formal training and years of experience building and testing models. Their success is usually (with some exceptions) measured by accuracy of their forecasts and insight. They often have much less visibility, and frequently no specific mission, unless they work for a firm that emphasizes a single product.
One of the easiest ways the average investor can sort through the noise is by demanding some qualifications. Just check the bios of the sources. There are people who rise to the top of economic and statistical analysis without going through the program – Bill McBride and Nate Silver come rapidly to mind – but they are exceptions. They use professional techniques. Join me in becoming a demanding consumer of economic conclusions. (Hint: Quit reading when the post refers to Econ 101!)
Collective surveys like that reported monthly by the Wall Street Journal can be very helpful. Right now the consensus conclusion is an improving economy growing to the 3% trend level. Why? The long-term history shows that a free market economy works to employ slack resources, and we have plenty of that! This is not a business cycle peak, and therefore we do not face an imminent recession.
The investment conclusion should be that we are still in the middle innings of a prolonged recovery cycle, with plenty of time to enjoy the results.
What does that mean for investors? Stay focused on risk and fundamentals – not stock prices. The post-2000 market results have frightened an entire generation of investors. Whenever there is a bad stretch in the market, however brief, they are afraid of another "big one."
You can imitate what I do for clients.
- Use our recession and financial stress indicators to warn of major risk. None of the major market declines occurred without a warning from these signals. When we get an elevated level, we reduce positions.
- Right-size your positions. Expect that there will be 15-20% market drawdowns without a fundamental explanation. If this move will be too upsetting, your position is too big and you will bail out at the wrong moment. This is how I approach it with investors, and it is better than the silly questionnaires that some big firms use for CYA compliance.
- If your position is the right size, then you are ready to be greedy when others are fearful – and vice-versa.
- And most importantly, be willing to change with your indicators. If we see heightened risk, we will cut back on position size, just as we did in 2011.
And keep in mind, what we saw two weeks ago was a minor pullback from fresh highs. It was not even close to a full-blown correction, despite the media coverage. If you became uncomfortable and blew out of your position, it shows that you had not accurately evaluated risk.
Investing is not like a poker game, where you go "all in" or completely sit out.

